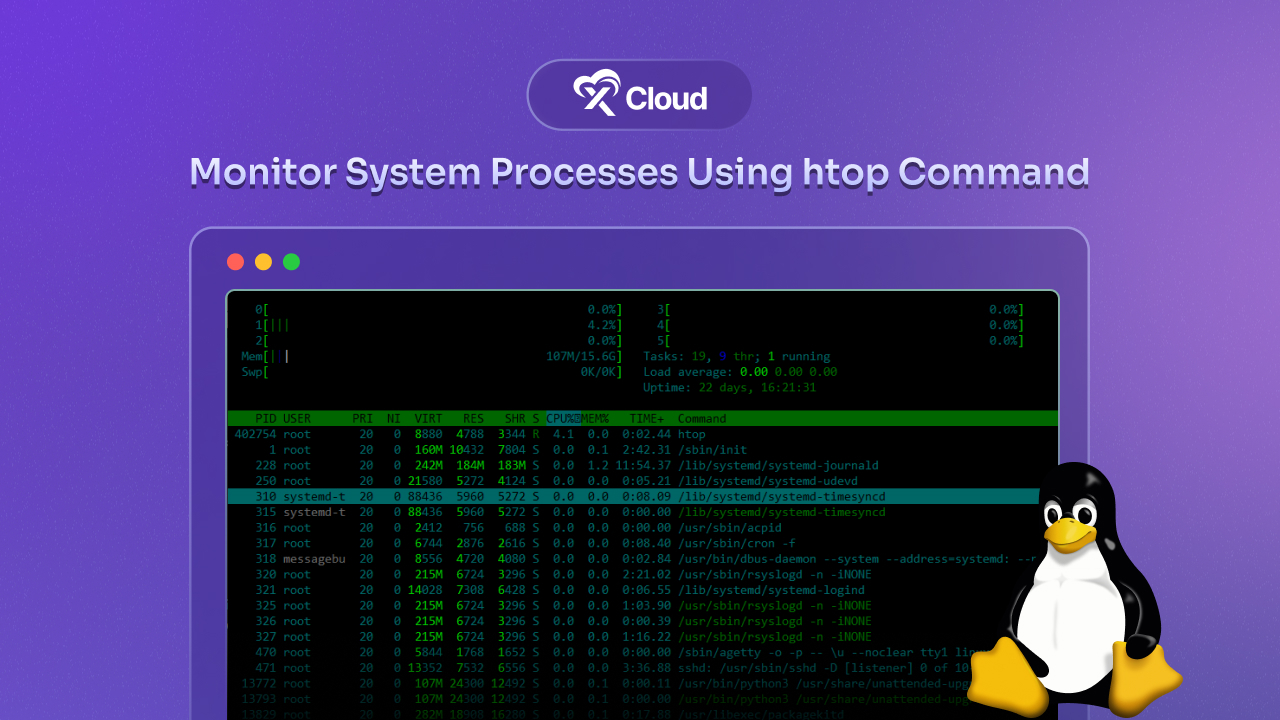
Are you frustrated by slow performance or struggling to troubleshoot system issues? Monitoring your system processes is essential for ensuring smooth operations. Here comes, htop – a popular tools for real-time system monitoring in Unix-based systems provides a visual, interactive interface that lets you quickly assess your system’s health, from CPU and memory usage to running processes. In this guide, we will learn into how to use htop to monitor system processes effectively.

What Is htop or hTop Command?
htop is an interactive system-monitoring tool available for Unix-based operating systems. It is a modern alternative to the traditional top command, featuring an intuitive, colorful, and scrollable interface. htop gives users a real-time overview of system resources like CPU, memory, and disk usage while allowing the inspection of individual processes in greater detail. It also offers the flexibility to sort and filter processes, send signals to them, and adjust system priority. Unlike top, htop provides the following benefits:

- A colorful, customizable display
- The ability to scroll horizontally and vertically to view all processes
- Mouse support for navigating the interface
- Enhanced filtering and sorting options
Why Use htop Command?
htop command is a versatile tool for monitoring system resources, especially useful for administrators and power users who need real-time visibility into what is consuming their system resources. By using htop, you can:
- Identify processes that are consuming too much CPU or memory
- Find out which processes are running and their hierarchy
- Sort processes by various metrics such as memory or CPU usage
- Easily kill or renice (adjust the priority of) processes directly from the interface
- Monitor system load and performance indicators, including CPU, memory, and disk I/O in real time
With its rich feature set, htop is an invaluable tool for anyone looking to optimize system performance and troubleshoot issues efficiently.
Maximizing System Monitoring: Using htop With xCloud
Integrating htop into your xCloud environment elevates your system monitoring capabilities significantly. This powerful tool provides real-time, in-depth insights into system processes and resource consumption, empowering you to manage workloads with precision and ease.
If you’re operating high-demand applications or juggling multiple users, htop becomes indispensable. Its features, such as process filtering, hierarchical displays, and priority adjustments, streamline troubleshooting and boost performance optimization. Combined with xCloud’s robust infrastructure, htop ensures seamless monitoring and efficient system management, making it a perfect fit for dynamic environments.
For a comprehensive guide on htop read our full documentation.
👉How to Monitor System Processes Using the htop Command
Advanced htop Usage: Monitoring And Managing Processes
Now that you know the basics of htop, let us explore some more advanced features that make it a powerful tool for monitoring and managing processes.
1. Filtering And Searching Processes
To find a specific process, press F3 or / (slash) to open the search box. Type part of the process name, and htop will highlight matching processes. This is particularly useful on busy systems with many running processes.
2. Sorting Processes
You can change the sorting criteria to get a clearer view of which processes are using the most resources. To do this, press F6 and choose from options like %CPU, %MEM, and TIME+. Sorting by memory usage or CPU time is helpful for identifying resource-intensive processes quickly.
3. Viewing Processes in Tree Structure
To see processes in a hierarchical structure, press F5 to switch to Tree View. This view shows parent-child relationships between processes, making it easier to understand the process hierarchy. This is useful for visualizing how services spawn subprocesses.
4. Adjusting Process Priority
If you want to change the priority of a process, use the F7 and F8 keys to “renice” it (adjust its nice value). Lowering a process’s nice value (towards -20) gives it higher priority, while increasing it (towards 19) gives it lower priority. Adjusting process priorities can help manage system load and optimize performance.
5. Killing a Process
To kill a process directly from htop, select the process you want to terminate, press F9, and choose the signal to send (e.g., SIGTERM for a graceful shutdown or SIGKILL to force-stop the process). Killing processes can be useful if you have unresponsive applications or runaway processes consuming excessive resources.
1. Identifying High CPU Or Memory Usage
When your system slows down, htop can quickly identify processes with high CPU or memory usage. By sorting the process list, you can pinpoint resource hogs and take action, whether it’s lowering their priority or killing them altogether.
2. Checking System Load on a Server
For administrators managing remote servers, htop offers a quick way to check system load, uptime, and resource consumption. This can help diagnose performance bottlenecks or troubleshoot resource-related issues efficiently.
3. Managing Multiple Users on a Shared System
On shared systems, htop can help monitor which users and processes consume the most resources. This is particularly useful in multi-user environments where you might want to ensure fair resource distribution.
4. Diagnosing Application-Specific Issues
If a particular application is slow or unresponsive, htop can reveal if the process is consuming excessive CPU, memory, or I/O. You can also use the Tree View to check if it has spawned any subprocesses that may be causing the issue.
Simplify Monitoring & Optimize performance With htop
htop is an essential tool for monitoring and managing processes on Unix-based systems. Its intuitive interface, customization options, and real-time updates make it far superior to traditional tools like top. By using htop, you will be equipped to diagnose and resolve system performance issues, manage processes efficiently, and optimize resource usage. So next time your system feels sluggish or you are curious about what is happening under the hood, launch htop and take a closer look!
If you have found this blog helpful, feel free to subscribe to our blogs for valuable tutorials, guides, knowledge, and tips on web hosting and server management. You can also join our Facebook community to share insights and engage in discussions.


