


To run Grafana in Docker, you start the official image with port 3000 and a named volume on /var/lib/grafana, set your own admin login, and put HTTPS in front. Doing it by hand takes longer, since you also set up the proxy and SSL yourself; with One-Click Apps on xCloud it is one short form.
The container is the easy part. What decides whether your dashboards are safe is everything around it: who can reach port 3000, whether admin/admin still works, and whether you can restore the volume.
This guide covers both paths step by step: Docker Compose on any Ubuntu server, then the one-click way on xCloud. New to containers? Read what Docker Compose is first.

TL;DR
- Requirements: 512 MB RAM and 1 CPU core is Grafana’s own minimum, “a floor for evaluation.” Plan more for a team.
- Docker way: a short Compose file with
grafana/grafana-enterprise, port 3000 and a volume on/var/lib/grafana. Then add HTTPS yourself. - The trap: Grafana’s docs example publishes
3000:3000. Docker’s own firewall docs say published ports bypass UFW, so the plain-HTTP login page can be open atSERVER_IP:3000. - First login: the default is
admin/admin. Set your own admin login before the first start. - One-click way: on xCloud, pick Grafana in One-Click Apps. Grafana is only reachable through your domain, not by server IP and port. HTTPS is set up, sign-up is off and the admin password is generated.
- Still on you, either way: data sources, SMTP for email alerts, and version upgrades.
The Port Line That Decides Who Sees Your Login Page
If you only remember one line: check the ports line in your Compose file, not just your firewall.
Grafana’s official Docker guide uses '3000:3000' in its Compose example. With no address in front, Docker publishes the port on every network interface, the public one included.
Most people then add a UFW rule and assume the port is closed. It is not. Docker’s firewall documentation says traffic to a published port “gets diverted before it goes through the ufw firewall settings.”
So, going by Docker’s own docs, Grafana’s login page can answer on http://SERVER_IP:3000 over plain HTTP, even if you also set up a domain with HTTPS. A cloud provider firewall in front of the server can still block it, but UFW on the server will not.
We have not tested this on a server ourselves; the behaviour above comes from Docker’s documentation. To see whether your own server’s port 3000 is open, run this from your laptop, not from the server:
curl -I --max-time 5 http://SERVER_IP:3000/loginAny HTTP response means the login page is public. A timeout or “connection refused” means the port is closed to the outside.
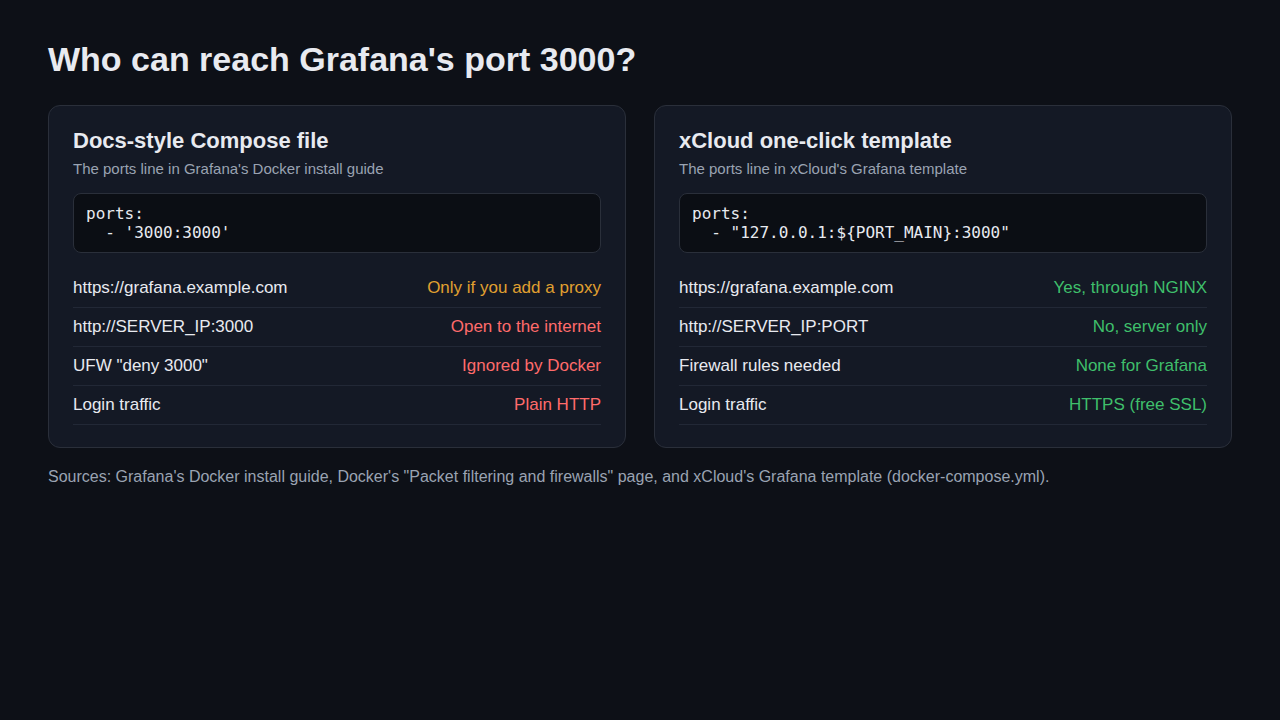
xCloud’s Grafana template writes the line differently: "127.0.0.1:${PORT_MAIN}:3000". Grafana is then only reachable through your domain, not by server IP and port. If you go the manual route, make the same change. Step 2 below shows it.
What You Need to Self-Host Grafana
These figures come from Grafana’s installation requirements and xCloud’s Grafana template.
| Resource | Minimum | Note |
|---|---|---|
| RAM | 512 MB | Grafana’s figure, “a floor for evaluation rather than a production target” |
| CPU | 1 core | Same source |
| Disk | 2 GB | xCloud template minimum; grows with plugins and dashboards |
| Database | SQLite (built in) | Grafana says SQLite “isn’t recommended for production”; MySQL 8.0+ or PostgreSQL 12+ are supported |
| Ports | 80 and 443 public | Keep 3000 private behind a reverse proxy |
| Domain | One subdomain | For example grafana.example.com, pointed at the server |
Grafana does not collect metrics itself. It queries the data sources you connect, such as Prometheus, Loki or MySQL. So the server size depends on how many people open dashboards and how many alert rules run, not on how much data you keep.
Option 1: Self-Host Grafana With Docker Compose
Here is the manual path on an Ubuntu server with Docker Engine and the Compose plugin installed, and a domain pointed at the server.
Step 1: Create a project folder and an env file
mkdir ~/grafana && cd ~/grafana
nano .env
Put your admin login and public URL in .env. These are standard Grafana settings, the same ones xCloud’s template uses:
GF_SECURITY_ADMIN_USER=youradmin
GF_SECURITY_ADMIN_PASSWORD=use-a-long-random-password
GF_USERS_ALLOW_SIGN_UP=false
GF_SERVER_ROOT_URL=https://grafana.example.com
Then run chmod 600 .env so only your user can read it. For stricter setups, Grafana also reads secrets from files: GF_SECURITY_ADMIN_PASSWORD__FILE=/run/secrets/admin_password.
Step 2: Write the Compose file
Create docker-compose.yml. This is Grafana’s example with two changes: the port only answers on the server itself, and the env file is loaded.
services:
  grafana:
    image: grafana/grafana-enterprise
    container_name: grafana
    restart: unless-stopped
    env_file:
      - .env
    ports:
      - '127.0.0.1:3000:3000'
    volumes:
      - grafana-storage:/var/lib/grafana
volumes:
  grafana-storage: {}
Grafana’s guide calls the Enterprise image “the recommended and default edition,” free and with every OSS feature. Use grafana/grafana if you want the open-source build. Either way, pin a version tag in production, so a later docker compose pull never jumps to a new major version by surprise.
Step 3: Start Grafana
docker compose up -d
docker compose ps
docker compose logs -f grafana
The container should show Up. To check it, run curl -I http://127.0.0.1:3000/login on the server; expect an HTTP response. From your laptop, expect SERVER_IP:3000 not to answer, because the port is bound to the server only.
Step 4: Put HTTPS in front
Grafana now answers only on the server, so a reverse proxy has to publish it. With Caddy, which fetches a Let’s Encrypt certificate on its own, the whole config is:
grafana.example.com {
    reverse_proxy 127.0.0.1:3000
}
NGINX with Certbot works too; it is just more lines. Keep GF_SERVER_ROOT_URL matched to the real domain, or links in alert emails and redirects point to the wrong place.
Step 5: Sign in and add a data source
Open https://grafana.example.com and sign in with the admin login from .env. If you skipped Step 1, Grafana’s sign-in guide says the default is admin for both fields, followed by a prompt to change the password. Change it before you do anything else.
Then go to Connections → Data sources and add Prometheus, Loki, MySQL or whatever holds your metrics. Plugins can be preinstalled with one variable, for example GF_PLUGINS_PREINSTALL=grafana-clock-panel.
Option 2: One-Click Grafana on xCloud
The one-click path replaces Steps 1 to 4 with a form. The general flow for every app is in 👉 how to use One-Click App templates in xCloud.
Step 1: Pick or create an NGINX server
Grafana runs in a container, so it needs an NGINX server. It can be one that already hosts WordPress or PHP sites; xCloud installs Docker during the app install if it is missing. Choose an xCloud Managed Server or connect your own VPS from DigitalOcean, Vultr, Hetzner, AWS or Linode.
Step 2: Choose Grafana in One-Click Apps
Go to Sites → New Site, select One-Click Apps and search for Grafana. Select the server. If the server is too small, the card shows a badge such as Needs … GB RAM and a Resize or upgrade this server or Get a larger server link. See Grafana hosting on xCloud for what the template includes.
Step 3: Fill in the admin login and the domain
The form asks for two things under Admin Credentials: an Admin Username (defaults to admin) and an Admin Password, generated at 24 characters if you leave it blank. If you let xCloud generate it, copy it later from the Grafana Credentials box on the app overview. Choose Go Live for your own domain or Demo Site to try it first, then click Create.
Step 4: Sign in
When the install finishes, open your domain over HTTPS and sign in with the credentials shown on the app overview. Public sign-up is already off, so only people you invite can sign in. Add teammates under Administration → Users and access → Users. Then add your data sources from Connections → Data sources.
Behind the form, xCloud runs Grafana 12.4, keeps your dashboards in their own storage that survives updates, makes Grafana reachable only through your domain, not by server IP and port, and checks that it is running.
Updates, Backups and Security After Install
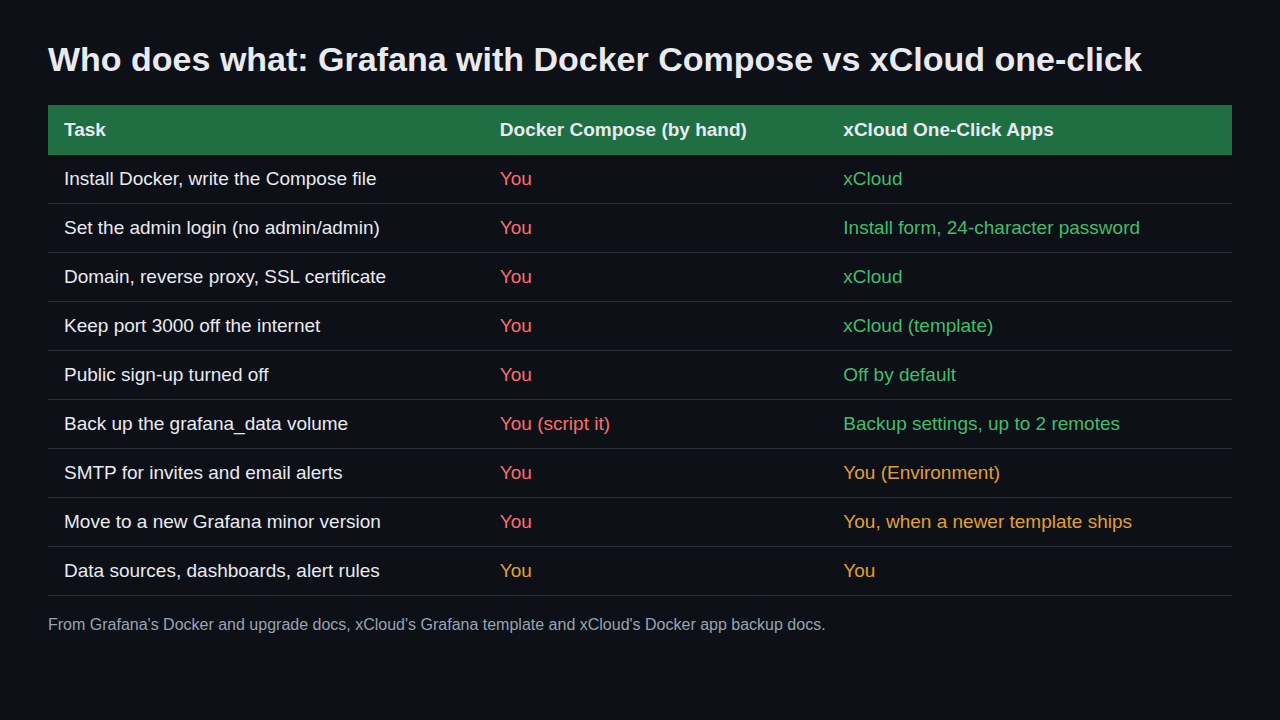
Back up the volume, not just the server
Everything Grafana knows lives in /var/lib/grafana: the grafana.db SQLite database with dashboards, users, data source settings and alert rules, plus plugins. Lose that volume and you rebuild every dashboard by hand.
On a manual setup, Grafana’s upgrade guide for 12.4 says to shut Grafana down before you copy the SQLite database. One way, after docker compose stop:
docker volume ls | grep grafana
docker run --rm -v <your-volume-name>:/data -v "$PWD":/backup alpine \
  tar czf /backup/grafana-$(date +%F).tgz -C /data .
docker compose start
Compose usually adds the project folder name to the volume (expect something like <folder>_grafana-storage), so put the exact name from docker volume ls in place of <your-volume-name>. Copy the archive off the server.
On xCloud, open the site and go to Backup → Previous Backups → Backup Now, or schedule backups under Backup Settings with up to two remote destinations. The capture briefly stops the app. 👉 Backup and restore Docker apps.
Update without losing dashboards
On a manual setup, docker compose pull && docker compose up -d recreates the container on the new image and keeps the volume. Back up first, and read the upgrade notes for the version you are moving to.
On xCloud, App Actions → Update pulls the grafana/grafana:12.4 image again and recreates the container with your data kept; it stays on 12.4. 👉 Update a One Click App and edit its Docker Compose.
Set up SMTP for invites and email alerts
Neither path sends email until you add a mail server. On xCloud, open Environment, add GF_SMTP_ENABLED=true, GF_SMTP_HOST=smtp.example.com:587, GF_SMTP_USER, GF_SMTP_PASSWORD and GF_SMTP_FROM_ADDRESS, and click Save & Redeploy. On a manual setup, add the same variables to .env and run docker compose up -d.
What This Setup Does Not Do
Here is the honest list, for both paths:
- No metrics on its own. Grafana draws dashboards from data sources. You still need Prometheus, Loki, a database or another source running somewhere.
- xCloud’s version trails upstream. The template pins Grafana 12.4. Newer Grafana releases are available upstream (see Grafana’s download page). App Actions → Update stays on 12.4. To move to a newer version, take a backup, then change the image tag on the Compose page (advanced), or wait for a newer template.
- SQLite only, out of the box. Both setups here use Grafana’s built-in SQLite database. For high availability, Grafana requires MySQL or PostgreSQL, which you configure yourself.
- No automatic upgrades. Nothing updates itself on either path. You choose when to pull a new image.
- Not Grafana Cloud. This is the self-hosted server. xCloud has no affiliation with Grafana Labs.
To undo a one-click install, delete the site from the dashboard, after taking a backup if you might want the dashboards. On a manual setup, docker compose down stops it and docker compose down -v also deletes the volume, so be careful with -v.
Docker Compose vs One-Click: Which to Choose
| Docker Compose (by hand) | xCloud One-Click Apps | |
|---|---|---|
| Software cost | Grafana is free; you pay for the server | Grafana is free; you pay for the server and your xCloud plan |
| Setup time | Longer, since you also set up the proxy and SSL | One form |
| Image | Your choice, any version | grafana/grafana:12.4, pinned |
| Admin login | You set it in .env |
Install form, generated password |
| Who can reach Grafana | Anyone at SERVER_IP:3000 until you change the ports line |
Only through your domain |
| HTTPS | Your proxy and certificate | Free SSL, issued and renewed |
| Backups | Your script and storage | Scheduled, up to two remote destinations |
| Upgrades | Any version, any time | Update stays on 12.4; change the image tag on the Compose page (advanced) or wait for a newer template |
Rule of thumb: choose Docker Compose if you need the newest Grafana version, a custom image or full control over every file. Choose one-click if you want dashboards running today and would rather not maintain a proxy, a certificate and a backup script.
Run Grafana on Your Own Server With xCloud
xCloud gives you a self-hosted Grafana without assembling the pieces:
- Grafana deployed from One-Click Apps on an NGINX server
- Admin password generated, public sign-up off
- Your domain with a free SSL certificate
- Grafana only reachable through your domain
- Scheduled Docker app backups with remote copies
- Live server monitoring for the server under it
Deploy Grafana on xCloud → or browse the other one-click apps, including Loki for logs and Uptime Kuma for uptime checks. Prefer your own Compose file? Docker hosting on xCloud runs that too.
Get Your Grafana Dashboards Live This Week
If you know Docker and want the latest Grafana, the Compose path is a good fit. Just change the ports line to 127.0.0.1 and set your own admin login before the first start.
If you would rather spend that time building dashboards, deploy Grafana from One-Click Apps and schedule a backup on day one. Whichever direction you go, a private port 3000 and a tested restore are the two moves worth making first.
For more self-hosting guides, see how to self-host Supabase and self-host Nextcloud, or compare the best Docker hosting providers.
If you have found this blog helpful, feel free to subscribe to our blogs for valuable tutorials, guides, knowledge, and tips on web hosting and server management. You can also join our Facebook community to share insights and engage in discussions.
Frequently Asked Questions
How much RAM does Grafana need in Docker?
Grafana’s install guide lists 512 MB of RAM and 1 CPU core as the minimum, and calls that a floor for evaluation rather than a production target. Grafana queries your data instead of storing it, so the load grows with dashboards, users and alert rules.
What is the default Grafana login in Docker?
The username and password are both admin, and Grafana asks you to change the password at first sign-in. Set your own admin login with environment variables before the first start, because the default works for anyone who reaches the login page first.
Should I use the grafana/grafana or grafana/grafana-enterprise image?
Grafana’s Docker guide calls Grafana Enterprise the recommended and default edition, and says it is free and includes every OSS feature. The grafana/grafana image is the open-source edition. xCloud’s one-click template runs grafana/grafana.
Where does Grafana store its data in Docker?
In /var/lib/grafana inside the container. That folder holds the internal SQLite database (grafana.db) with your dashboards, users, data source settings and alert rules, plus installed plugins. Mount it on a named volume and back up that volume.
Does the xCloud one-click Grafana update itself?
No. The template pins Grafana 12.4. Update in App Actions pulls the grafana/grafana:12.4 image again and recreates the container with your data kept; it stays on 12.4. Back up the site before any update.