

How to Deploy Grafana With xCloud One Click Apps
Updated November 8, 2026 · 6 min read
You can run Grafana on your own server with xCloud without writing a Docker Compose file. Go to New Site, pick Grafana in the app catalog, choose a server, set the admin login, choose Demo Site or Go Live, and click Next. xCloud starts Grafana, keeps its data on persistent storage and serves it over HTTPS. This guide walks through each screen up to your first sign-in.
Who this is for: anyone who wants dashboards and alerts for the metrics, logs or databases they already have (Prometheus, Loki, MySQL and more), on a server they control. Grafana shows data from those sources; it does not collect data by itself.
What the Grafana app includes
| Part | What you get |
|---|---|
| Grafana version | The official grafana/grafana image, version 12.4 (the newest 12.4 fix release when you install). |
| Web address | Grafana runs behind xCloud’s Nginx on your domain, with an SSL certificate. |
| Saved data | Dashboards, data sources, users, plugins and alert rules are saved on the server, so they are kept when Grafana restarts or redeploys. |
| Admin login | You set the admin username and password in the install form. |
| Sign-up | Public sign-up is off. Only the admin can add users. |
Before you start
- An xCloud account that can create sites.
- An Nginx server with Docker, or permission to create a new server during setup. See the recommended size on the Grafana install page.
- For Go Live: a domain you can point at the server. For a first try, Demo Site needs no domain.
Step 1: Open New Site
From the xCloud dashboard, click New Site.

The What would you like to host today? page opens with the full app catalog.
Step 2: Find Grafana in the app catalog
Type Grafana in the search box, then click the Grafana card.
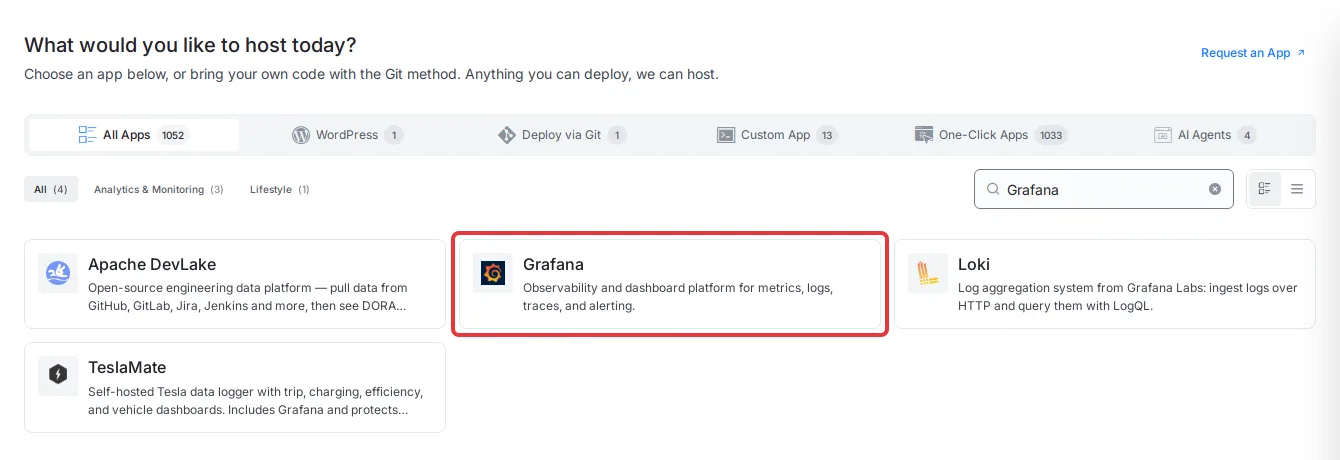
The Grafana page opens. It shows Runs on Nginx, Docker and the recommended server size.
Step 3: Choose where Grafana will run
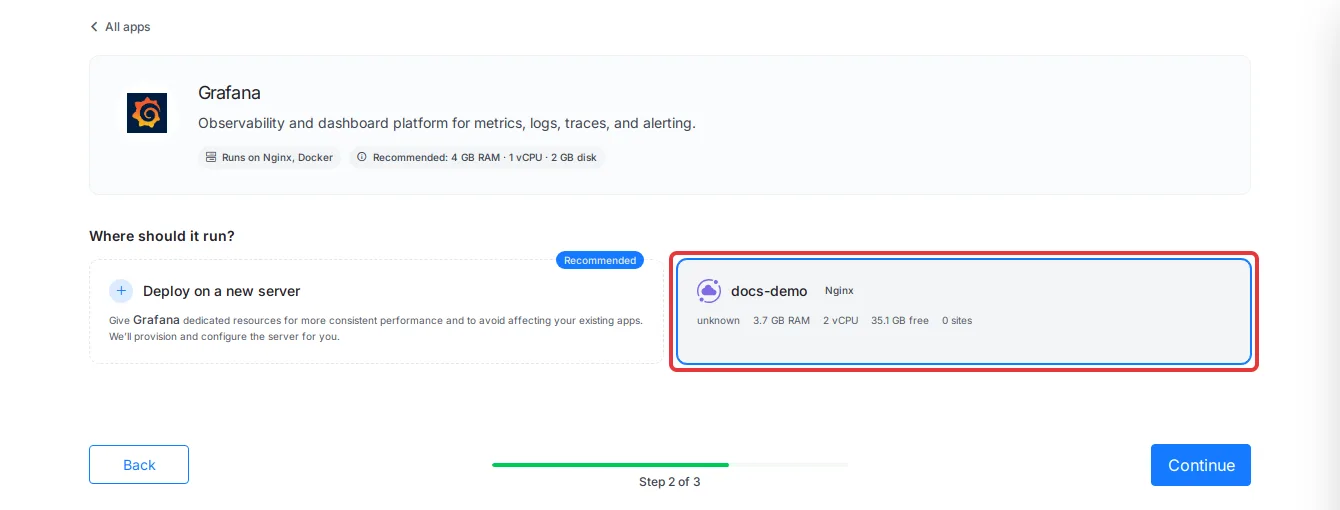
Under Where should it run?, pick one option:
- Deploy on a new server: xCloud creates and sets up a server only for Grafana.
- An existing server: click its card. Only servers that can run Grafana are listed, with their free RAM, CPU and disk.
Click Continue.
Step 4: Fill in the site details and the admin login
The Install Grafana Into form opens.
- Enter a Site Title, for example
Grafana. Add Tag (optional) helps you group sites. - Under Domain Setup, choose one:
- Demo Site: xCloud gives you a test domain, shown under Domain Name. Click Regenerate for a different one. Use this to try Grafana first.
- Go Live: enter your own domain and point its DNS at the server.
- Under Admin Credentials, keep or change the Admin Username (default
admin; letters, numbers, dashes and underscores, up to 32 characters). - Enter an Admin Password of 8 to 64 characters, or leave it empty and xCloud generates a secure 24-character password.
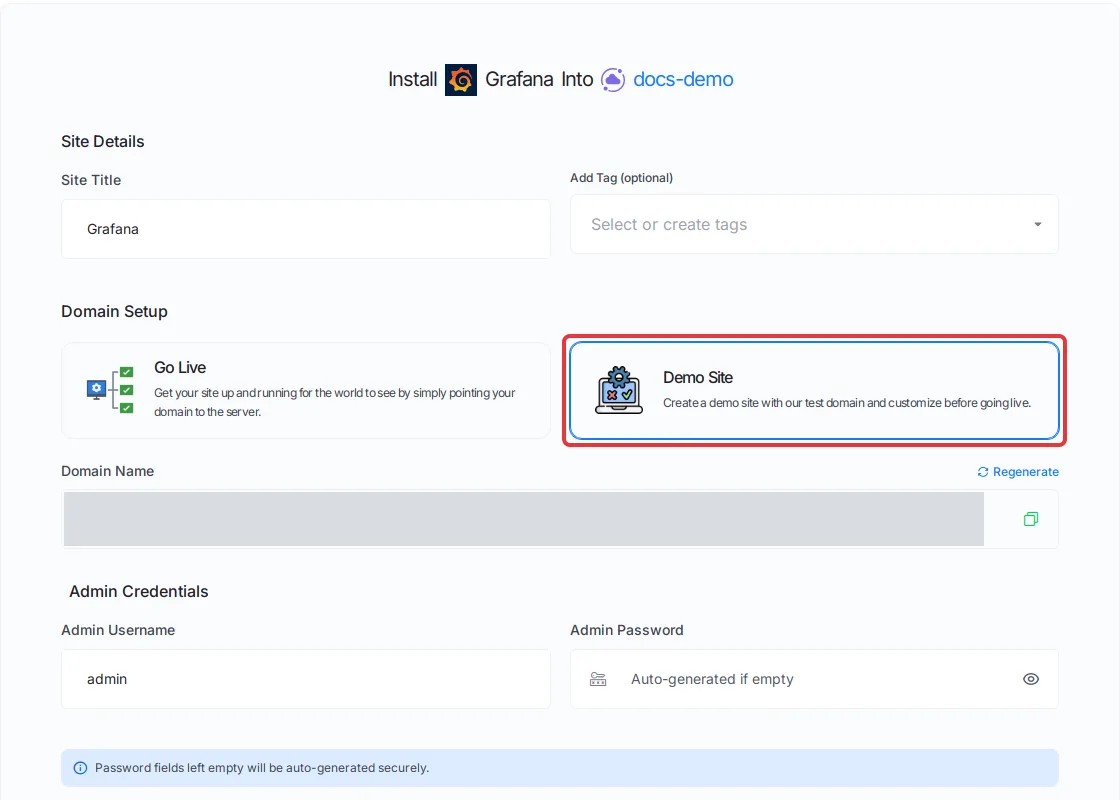
Click Next at the bottom of the form.
Step 5: Wait for the setup to finish
xCloud shows a progress page with each stage: checking the server, installing Docker, setting up the app, SSL, HTTPS and monitoring. You can leave this page; the setup keeps running.
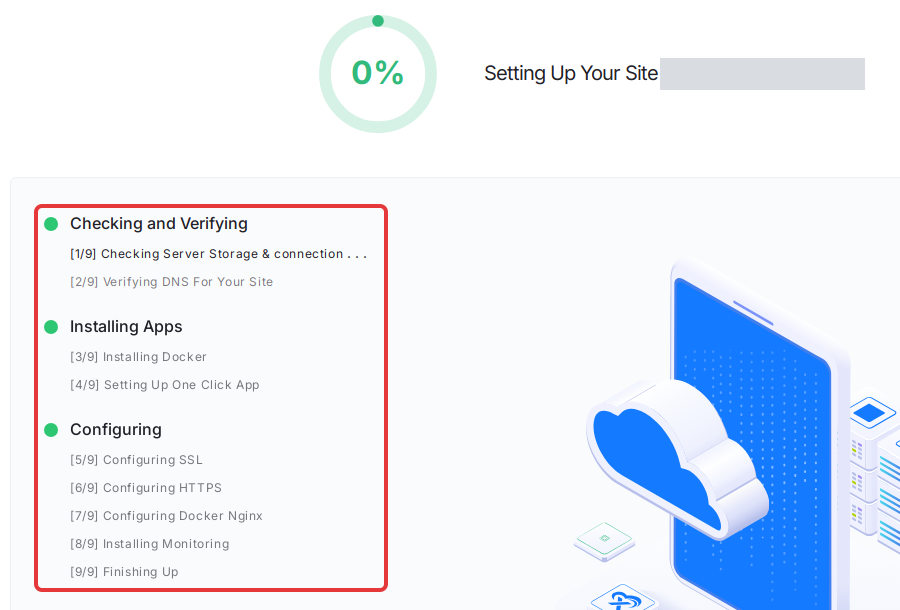
When it finishes, open the site from Sites to reach its Site Overview page.
If a stage fails, open Recent Events on the site, click View on the failed event, and fix what it reports (often DNS for Go Live, or a server that is too small). Then try again or contact support with the event output.
Step 6: Copy the Grafana admin login
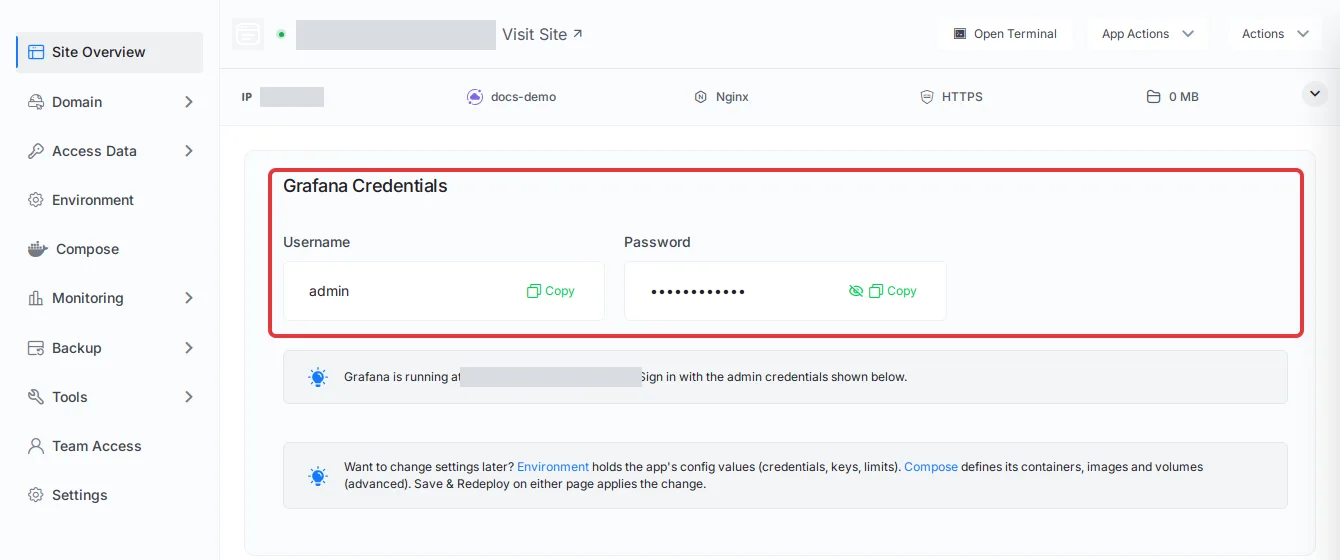
On Site Overview, the Grafana Credentials card shows the Username and Password. Use Copy next to each one. Click the eye icon to show the password.
Step 7: Sign in to Grafana
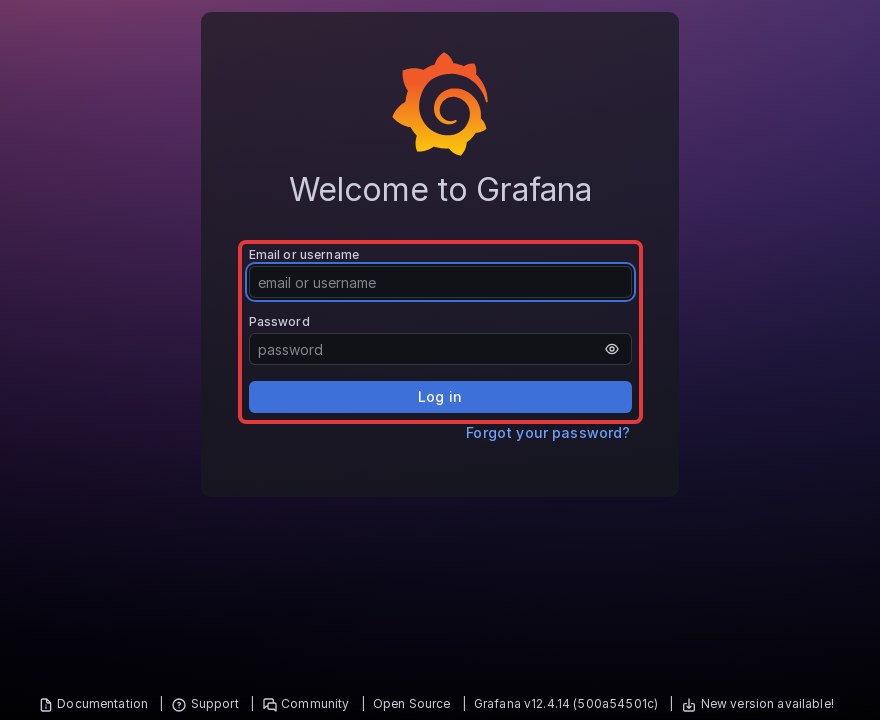
Click Visit Site at the top of the site page. Grafana opens its Welcome to Grafana page. Enter the username in Email or username, the password in Password, and click Log in.
You land on the Grafana home page. Your Grafana is ready.
After your first sign-in
| Task | Where | Why |
|---|---|---|
| Change the admin password | Your profile in Grafana | The password from the install form is only used when Grafana starts for the first time. After that, change it inside Grafana (Grafana docs). |
| Add a data source | Connections → Data sources in Grafana | Connect Prometheus, Loki, MySQL or another source, then build dashboards on it. |
| Add team members | Administration in Grafana | Public sign-up is off, so add each user yourself. |
| Turn on email | Environment on the xCloud site | Grafana needs SMTP for invites, password resets and alert emails. See below. |
Turn on email (SMTP)
Open the site in xCloud, click Environment, add these lines with your mail provider’s details, then click Save & Redeploy:
GF_SMTP_ENABLED=true
GF_SMTP_HOST=smtp.example.com:587
GF_SMTP_USER=your-smtp-username
GF_SMTP_PASSWORD=your-smtp-password
GF_SMTP_FROM_ADDRESS=[email protected]
GF_SMTP_FROM_NAME=Grafana
The same Environment page takes other Grafana settings, such as GF_AUTH_* lines for sign-in with LDAP, OAuth or SAML.
Update and back up Grafana
- Update: your site stays on Grafana 12.4. To move to a newer major or minor version, follow Update a One Click App and edit its Docker Compose.
- Back up: everything Grafana stores is in the
grafana_datastorage. See Back up and restore Docker apps for what xCloud backs up and how to restore it.
Common mistakes
- Choosing Go Live before the domain’s DNS points at the server. Start with Demo Site, then go live from the demo site.
- Changing the admin password in Environment (
GF_SECURITY_ADMIN_PASSWORD) and expecting the login to change. Grafana reads it only on first start; change the password inside Grafana instead. - Expecting Grafana to collect metrics by itself. Add a data source that already holds your data.
Frequently asked questions
Do I need to write a Docker Compose file to deploy Grafana on xCloud?
No. The Grafana One Click App already defines the Grafana container, its storage and the HTTPS proxy. You pick Grafana in the catalog, choose a server, fill in the form and click Next.
What server does Grafana need on xCloud?
An Nginx server with Docker. The Grafana install page shows the recommended server size, and only servers that can run Grafana are listed. If you have no suitable server, choose Deploy on a new server and xCloud sets one up for you.
Where do I find the Grafana admin password?
Open the site in xCloud. The Site Overview page shows a Grafana Credentials card with the username and password, each with a Copy button. If you left the password field empty in the install form, xCloud generated a 24-character password for you.
Can people sign up for my Grafana themselves?
No. Public sign-up is turned off in this app. Sign in as the admin and add other people from Administration in Grafana.
Related xCloud docs
- Grafana hosting on xCloud: plans and what is included
- All One Click Apps: the full catalog
- How to use One Click App templates: App Actions, the Environment editor and events
- Deploy Uptime Kuma with xCloud: uptime checks to pair with your dashboards
If you run into any issues while deploying Grafana, feel free to reach out to our support team.