

Live Server Monitoring
Updated August 25, 2026 · 2 min read
Live Monitoring lets users opt in to a lightweight server-header view of CPU, RAM, and disk usage. When enabled, xCloud shows the resource meters directly on the server page and refreshes the live values every 5 seconds while the page is open.
This is useful when a server shows recurring spikes or sustained resource usage that is hard to understand from a one-time terminal snapshot.
Prerequisites / required permissions
The server must be on a paid plan. Live Monitoring is not available on the free plan.
The user must have permission to manage server services.
The server must be connected for live polling. If live polling is unavailable, xCloud falls back to the latest stored monitoring snapshot.
How to use Live Monitoring
1. Open the server Monitoring page
Go to Servers → select a server → Monitoring. The Live Monitoring setting appears near the bottom of the Monitoring page.
2. Choose where to apply the change
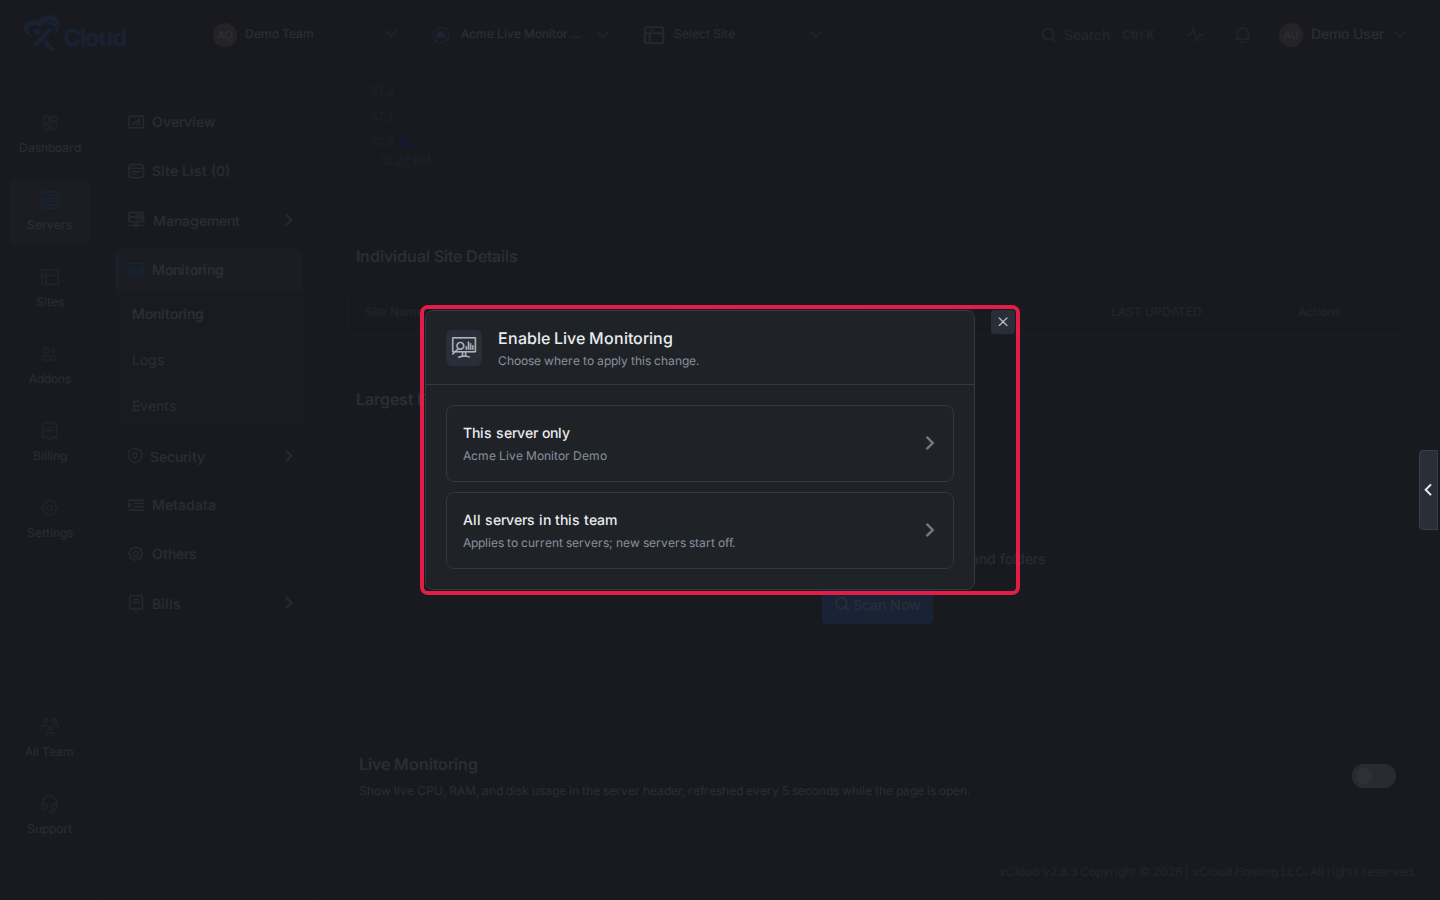
Turn the toggle on. xCloud asks whether to enable Live Monitoring for the current server only or for every current server in the team.
3. Read the live resource meters in the server header
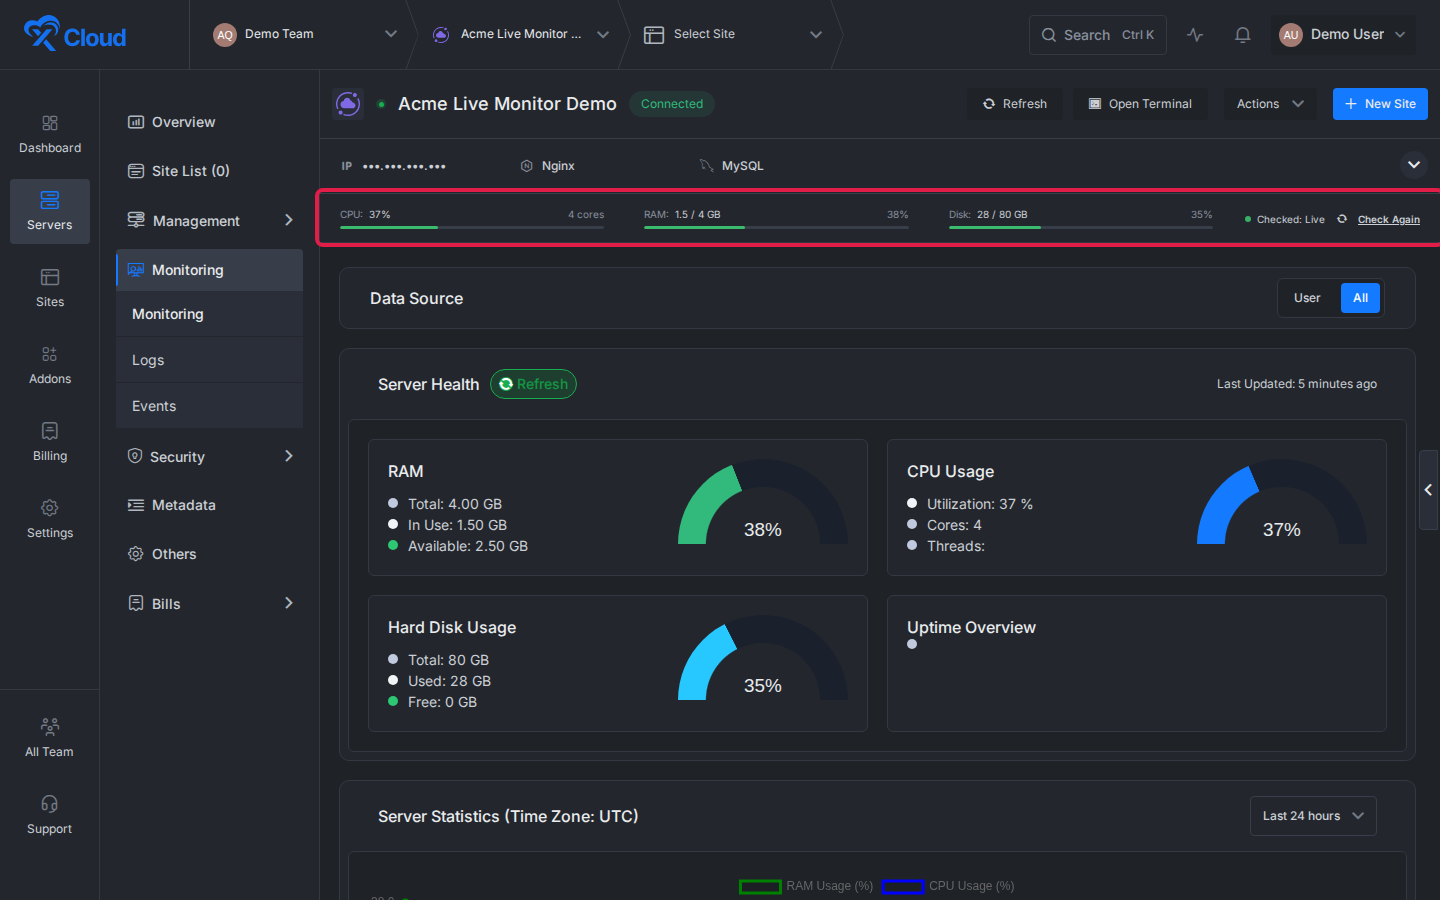
After Live Monitoring is enabled, the server header shows CPU, RAM, and disk meters. The header also shows whether the values are live and includes Check Again for a manual refresh.
Options & settings
| Option | What it does | Notes |
|---|---|---|
| This server only | Enables or disables Live Monitoring only for the selected server. | Best when investigating one server. |
| All servers in this team | Applies the setting to all current servers in the team. | Does not change the default for newly created servers. |
| Check Again | Manually refreshes the monitoring snapshot. | Available from the server header when the user can manage services. |
Limits / edge cases
Live Monitoring is opt-in and defaults to off. Free-plan servers cannot enable Live Monitoring. Live polling only runs for connected servers.
xCloud caches live metric probes per server so multiple viewers share one server-side probe window instead of creating redundant SSH checks.
If a live probe fails temporarily, xCloud keeps the UI stable and falls back to the latest stored monitoring data instead of flashing errors.
FAQ
How is this different from htop?
htop shows a live terminal snapshot. xCloud Live Monitoring puts CPU, RAM, and disk patterns in the server UI so users can spot repeated spikes and sustained usage while staying in xCloud.
Can I enable it for every server at once?
Yes. Use All servers in this team from the scope modal. This affects the team’s current servers only.
Will new servers inherit the team-wide setting?
No. New servers start with Live Monitoring off.
What happens if the server disconnects?
Live values are unavailable while the server is disconnected. xCloud can still show the latest stored monitoring snapshot when one exists.