


When fixing errors on WordPress sites, it’s important to quickly access your debug.log, error.log, and access.log files. With xCloud server & site logs, you can easily find everything you need right in the dashboard, saving you from searching through countless files. Additionally, xCloud provides an event section where you can monitor every update in real time to stay informed about your server or site activity.
Follow these steps to learn how to view logs and events of your server and site in xCloud.
How to View Logs & Events of Your Server in xCloud: Step-By-Step Guide #
Logs and events of any server are the sum of all your sites’ logs and events in one place. To view logs and events of your server, you need to follow these simple steps below.
Step 1: Locate Logs & Events of Your Server in xCloud Dashboard #
After logging into the xCloud dashboard, directly navigate to the server for which you want to view logs and events.
Server Logs: #
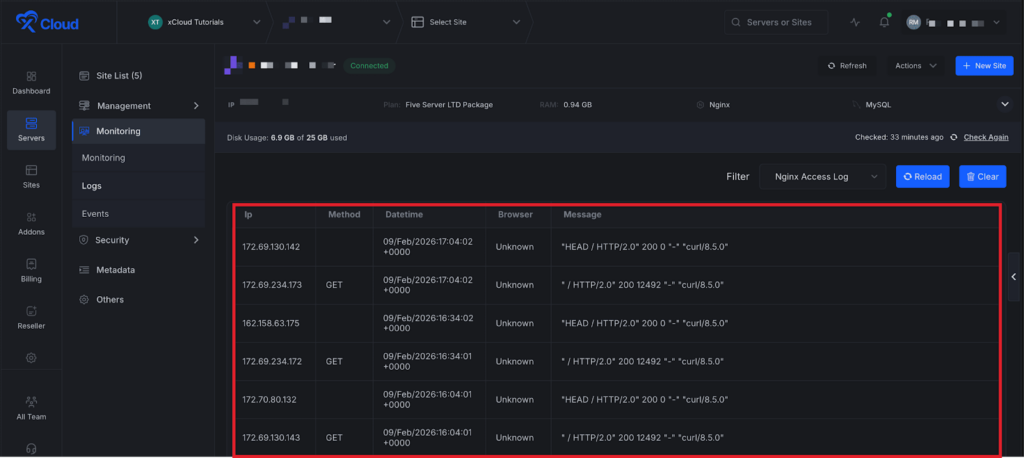
From the left of your dashboard, you’ll see both the ‘Logs’ option of your server. Click on the option. There are two types of logs you can see in server logs – Nginx Access Log & Nginx Error Log.
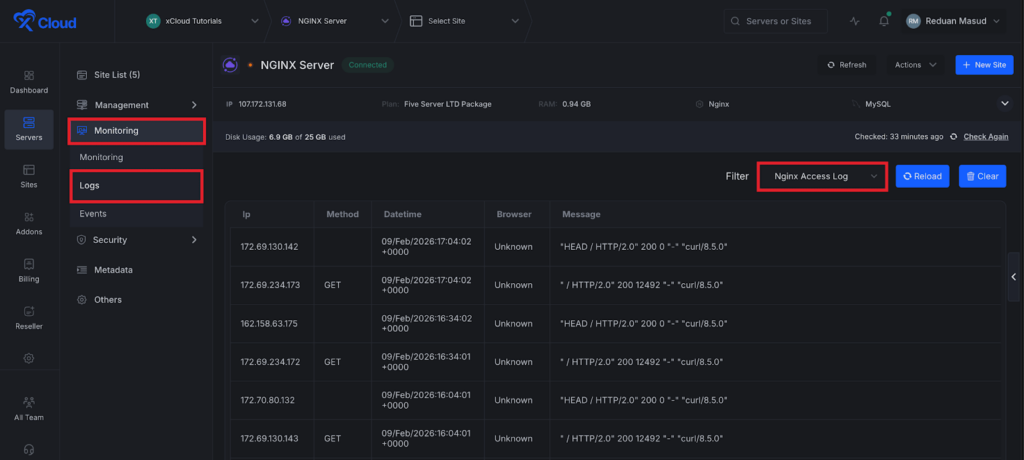
For each log, you’ll get information such as IP, Method, Datetime, Browser & the Message. However, you can reload and delete your server logs with 1-click from your dashboard.
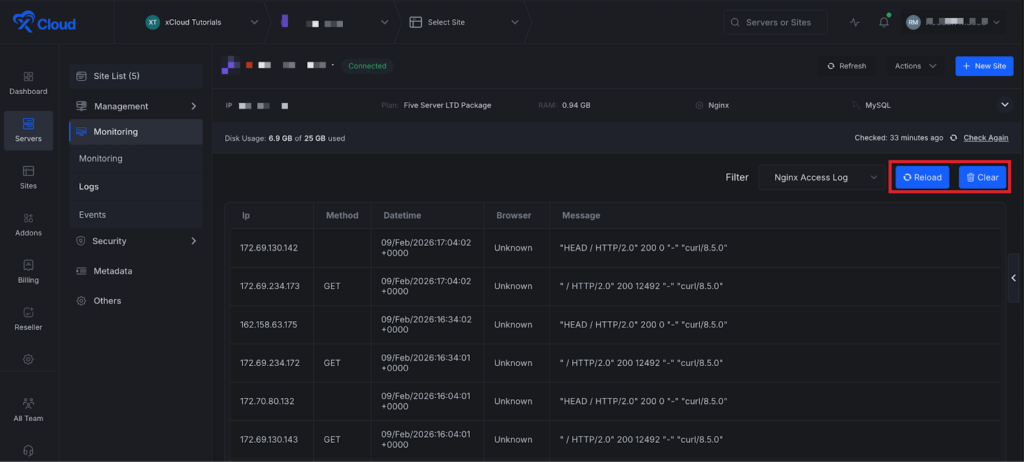
You can also click on the ‘Reload’ button to refresh and the ‘Clear’ button to clear all the logs.
Server Events: #
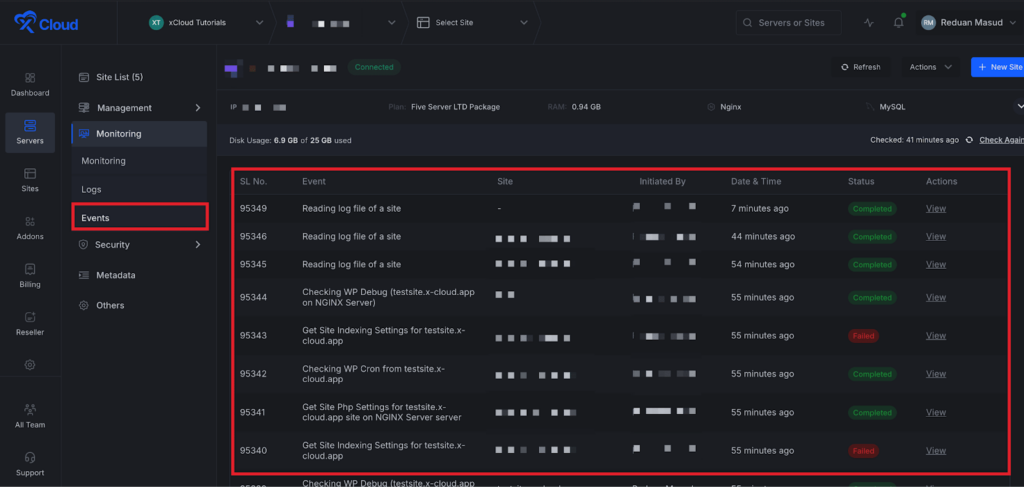
In the Events tab, you’ll get each second activity update of your server and all sites under your server. Each event is generated with a serial number, event name, the name of who initiated the activity, status, & Actions. You can view any actions by clicking on ‘View’ under ‘Action.’
How to View Logs of Your Site in xCloud: Step-By-Step Guide #
To view logs and events of your site, you need to follow these simple steps below.
Step 1: Locate Logs of Your Site in xCloud Dashboard #
After logging into the xCloud dashboard, directly navigate to the ‘ALL SITES’ tab & click on the site for which you want to view logs and events.
Step 2: View Your Site Logs #
From the left of your dashboard, you’ll see both the ‘Logs’ & ‘Events’ options of your site. Click each of them to view & explore what’s in there. Let’s dive in.
Site Logs:
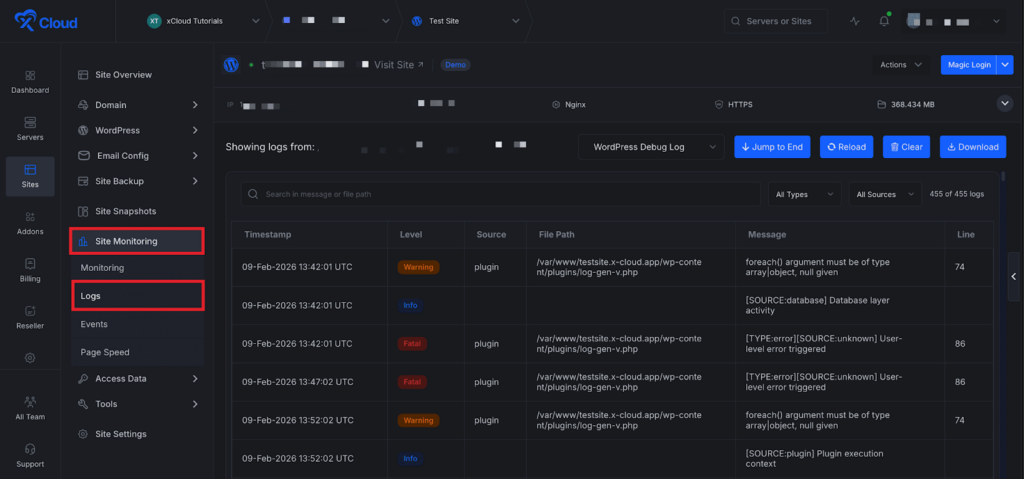
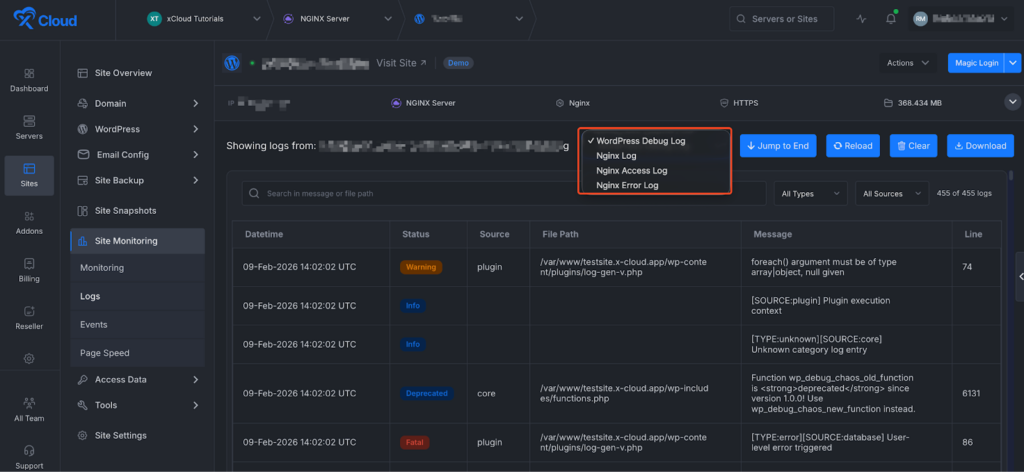
You’ll get 4 types of logs in your xCloud site log: WordPress Debug Log, Nginx Log, Nginx Access Log, and Nginx Error Log along with the path for each log.
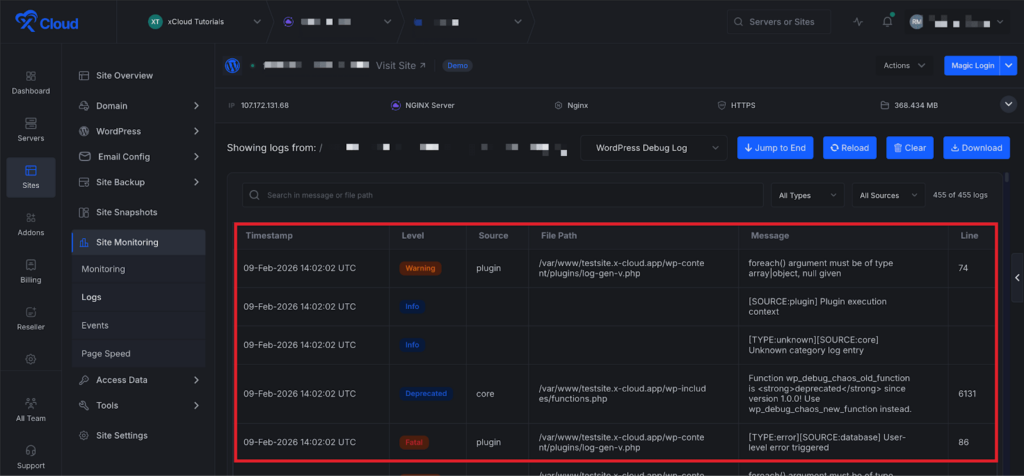
✅ WordPress Debug Log: #
The WordPress debug log (e.g., /var/log/nginx/shifat-resl.wp1.site-access.log), often referred to as debug.log, is a file that records error messages, warnings, and other debugging information generated by WordPress and its plugins or themes.
Now you get clearer and more detailed WordPress Debug Logs with visible issue statuses like Warning, Fatal, and more.
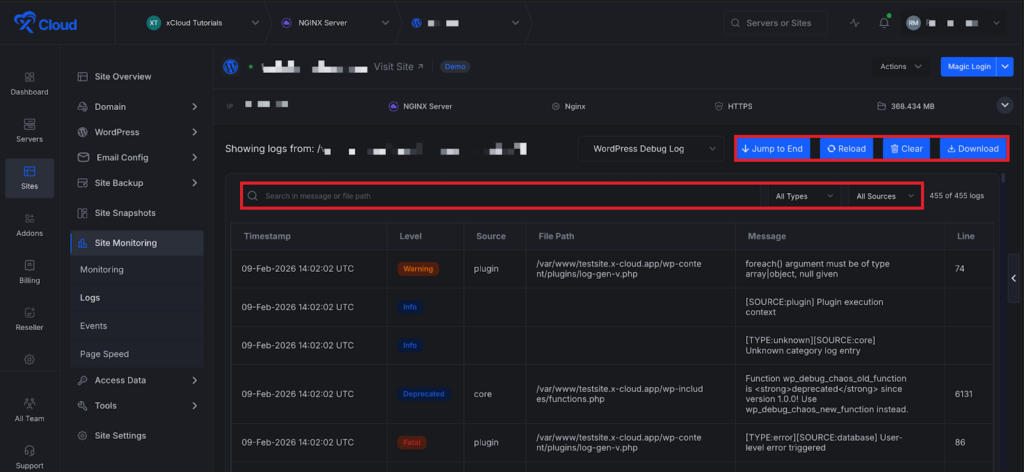
You can filter and sort logs by issue type for better readability. You can also download the logs directly via email for easy access and sharing.
Each log shows the timestamp, level, source, file path, message, and line number. You can filter by levels such as Warning, Fatal, Database, and more.
You can reload, clear, download, or search logs at any time using the available controls.
✅ Nginx Log: #
Nginx log (e.g., /var/log/nginx/shifat-resl.wp1.site*.log) is like a diary for your website. It keeps track of who visits, what they do, and if there are any issues. Having Nginx logs is crucial because it helps you understand how your website is performing, who your visitors are, and if there are any errors or problems.
✅ Nginx Access Log: #
Nginx Access Log (e.g., /var/log/nginx/shifat-resl.wp1.site-access.log) is more similar to Nginx Log. The log notes down details like who visited your site, what pages they looked at, and when they visited & gives you insights into your website’s traffic and helps you make decisions about how to improve your site.
✅ Nginx Error Log: #
The Nginx error log (e.g., /var/log/nginx/shifat-resl.wp1.site-error.log) is a record of errors that occur on your Nginx web server. It keeps track of any problems or issues that happen while your website is running. Having an Nginx error log is important because it helps website owners and developers identify and fix problems quickly.
How to View Site Events in xCloud: Step-By-Step Guide #
To view site events in just a few clicks, you need to follow these simple steps below.
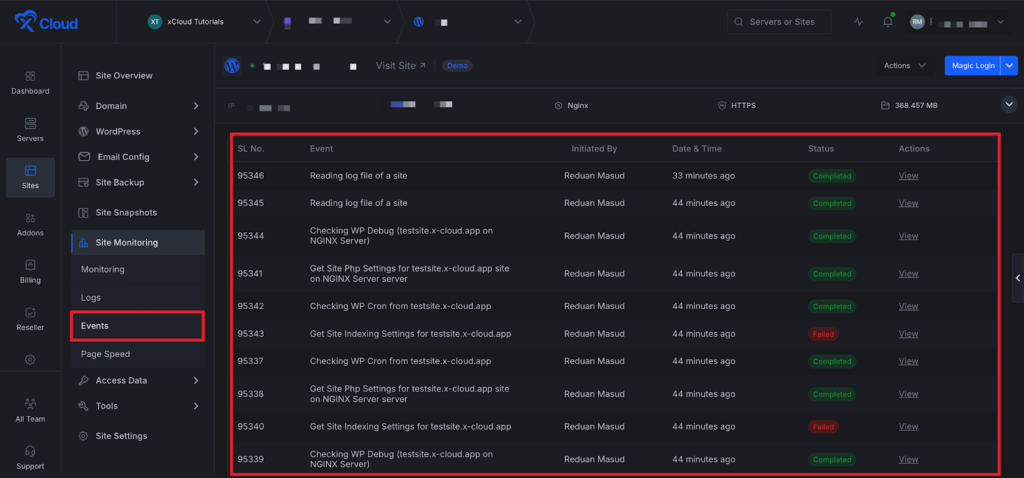
Site Events: #
Similar to server events, you can see specific site events too. Go to the ‘Site Monitoring’ → ‘Events’ from the sidebar In the ‘Events’ tab, you’ll get each second activity update of your site. Each event is generated with a serial number, event name, the name of who initiated the activity, status, & Actions. You can view any actions by clicking on ‘View’ under ‘Action.’
That’s it. By following the above steps, you can view logs and events of your server and site easily. Still have any queries? Contact our support team, they are just a text away.


