

How to Monitor a Site's RAM, CPU and Disk Usage in xCloud
Updated November 19, 2026 · 4 min read
Every site in xCloud has its own Monitoring page. It shows how much CPU, RAM and disk that one site uses, how that compares with the rest of the server, and charts of the last 24 hours or 7 days. Use it to find out whether a single site is the reason a server feels slow or full. For the whole server, see How To Monitor Server Resource Usage with xCloud, and for what the feature includes, see the server monitoring feature page.
Before you start
- A paid plan. On the free plan the page shows Monitoring Not Available and an Upgrade Plan button.
- An active site. The Refresh button is turned off while a site is disabled.
- A recent reading. A site created a few minutes ago may show Site usage data is unavailable until the server sends its next report.
Step 1: Open the site’s Monitoring page
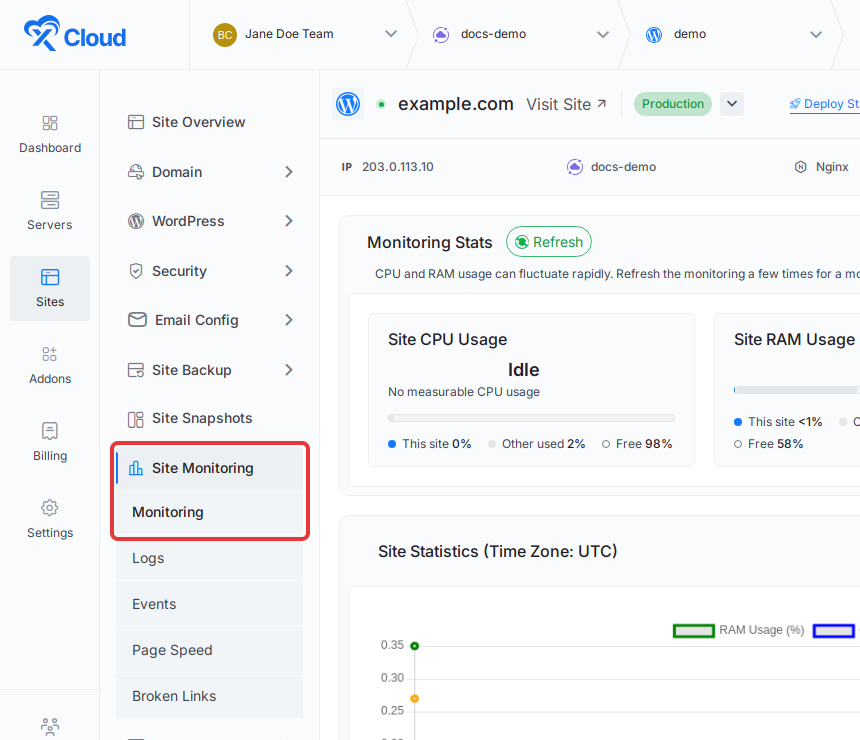
Go to Sites and open the site you want to check. In the site’s left menu, select Site Monitoring → Monitoring. On sites that are not WordPress, the menu is Monitoring → Monitoring.
The page opens with Monitoring Stats at the top and Site Statistics below it.
Step 2: Read the CPU, RAM and disk cards
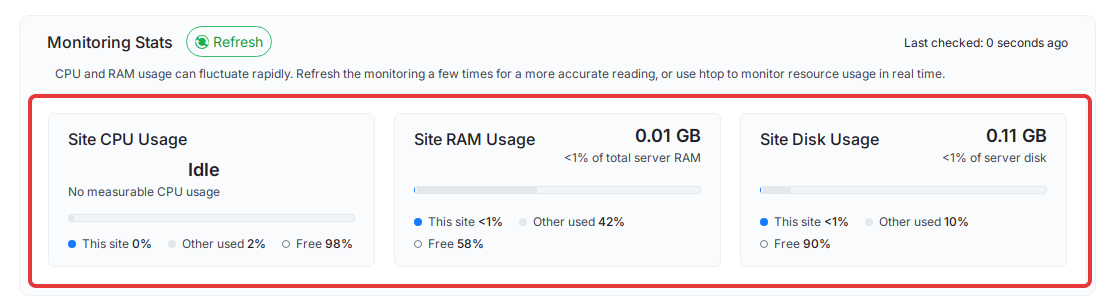
Under Monitoring Stats you see three cards. Each one shows this site’s use first, then a bar split into This site, Other used (everything else on the server) and Free.
| Card | What it shows |
|---|---|
| Site CPU Usage | The site’s CPU use in percent, followed by how many of the server’s CPU cores that equals. Idle with No measurable CPU usage means the site used no CPU when the reading was taken. |
| Site RAM Usage | The memory the site uses in GB, and its share of total server RAM. |
| Site Disk Usage | The space the site’s files take in GB, and its share of server disk. |
Hover over the info icon next to a card’s title to see the server’s own totals: how much the server uses in all and its total size, plus what is still free for RAM and disk. The site figures are estimated from the processes owned by the site’s system user.
If Other used is much larger than This site, another site or service is the bigger user. Compare your sites, or turn on Live Server Monitoring to see which sites and services use the most CPU or RAM right now.
Step 3: Refresh the reading
Click Refresh next to Monitoring Stats. xCloud takes a new reading from the server, updates the three cards and the chart, and Last checked updates to a few seconds ago.

CPU and RAM use can change from one second to the next, so the page suggests refreshing a few times for a more accurate reading. For a live view in a terminal, use htop.
If Last checked shows a warning icon, the last reading is a day old or more. Click Refresh to get a current one.
If the refresh fails: you see “Could not refresh monitoring for this site. Try again in a few minutes.” The old figures stay on screen. Wait a few minutes and click Refresh again. If it keeps failing, check that the server is connected on its Servers page.
Step 4: Check usage over time
The Site Statistics chart plots RAM Usage (%), CPU Usage (%) and Disk Usage (%) for this site. Times are in UTC. Open the range menu on the right and choose Last 24 hours or Last 7 days.
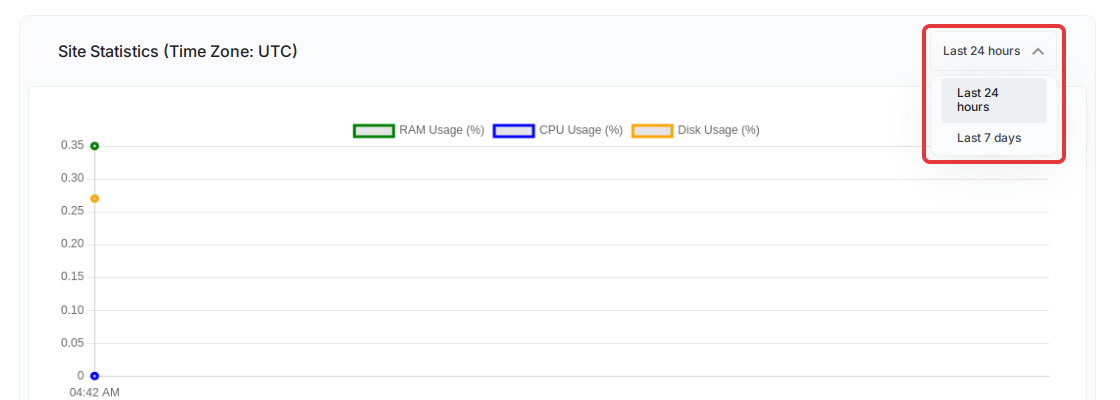
A steady climb in disk use usually means growing backups, cache or uploads. Where did my disk space go? shows how to find and clear them. Repeated CPU spikes on one site are often bot traffic: see Server at 100% CPU: Find the Culprit Site and Stop Bot Traffic.
What else is on the page
Below the chart, the same page shows:
- SSL Overview: the site’s DNS Status, SSL Status and certificate Expiry date.
- WordPress Logs (WordPress sites only): whether WordPress, plugins and themes are Up To Date or have an Update Available. Click an update line to open the site’s Updates page.
Site monitoring does not check whether your site is online. For uptime checks with alerts, deploy Uptime Kuma with xCloud. To have xCloud restart stopped services on its own, see auto healing.
Frequently asked questions
How does xCloud measure one site’s CPU and RAM?
Each site on an xCloud server runs as its own system user. The figures are estimated from the processes owned by that site’s system user, so you see that site’s share and not the whole server’s.
Why does a card say Site usage data is unavailable?
xCloud has no reading for that site yet, which is normal for a site created a few minutes ago. Click Refresh, or check again within about 30 minutes, when the server sends its next report.
Is site monitoring available on the free plan?
No. On the free plan the page shows Monitoring Not Available with an Upgrade Plan button. Site monitoring is included on paid plans, with no per-site fee.
Does site monitoring check whether my site is up?
No. It shows resource use, SSL and DNS status and WordPress updates. For uptime checks with alerts, run Uptime Kuma on xCloud.
If you run into any issues while checking your site’s resource usage, feel free to reach out to our support team.