

How to Use the Server Overview Dashboard in xCloud
Updated October 27, 2026 · 6 min read
The Overview is the first page you see when you open a server in xCloud. It shows the server’s resource usage, the health of its sites and services, its security and billing state, its runtime settings and its most recent sites on one screen, with a link from each card to the page where you change that setting. This guide walks through each card, so you know what every number means and where to go next.
The Overview arrived with the new server dashboard in xCloud v2.8.3. It looks the same on NGINX and OpenLiteSpeed servers; only the services listed differ.
Step 1: Open the server Overview
From your xCloud dashboard, go to ‘Servers’ and click the server you want to check. xCloud opens the server on ‘Overview’, the first item in the server menu. You can come back to it from that menu at any time.
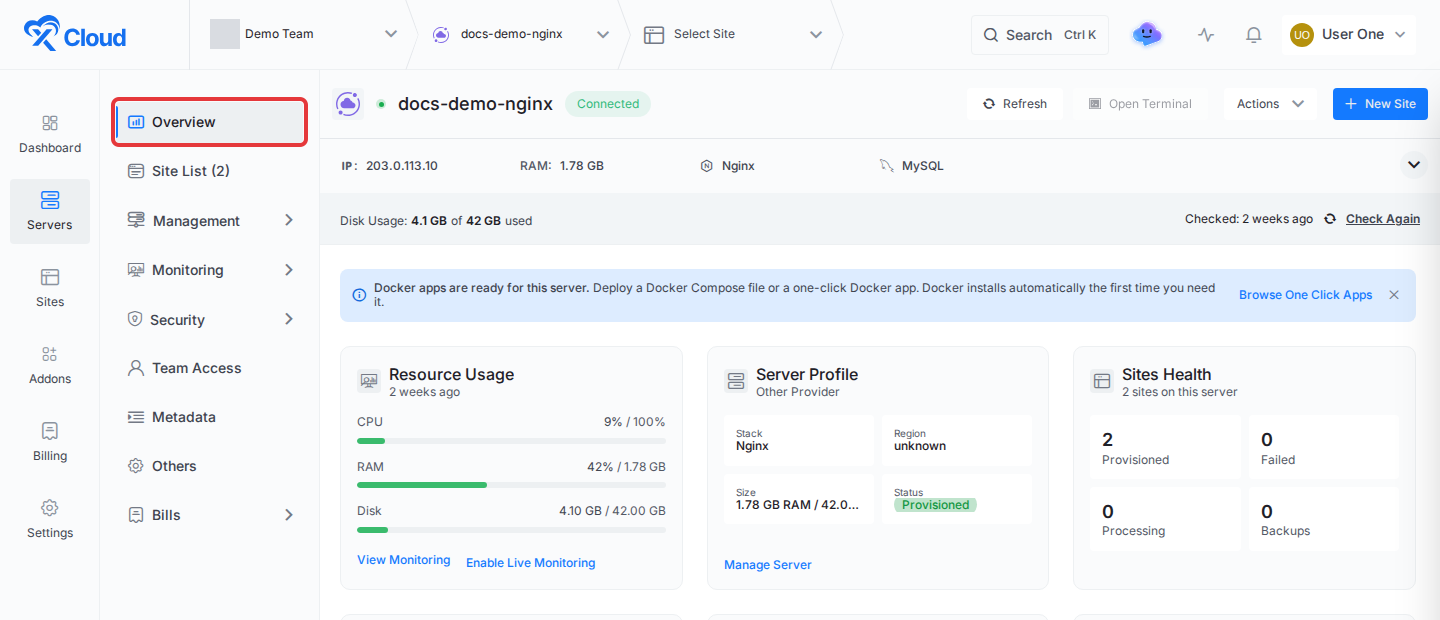
Servers running an AI agent stack open on ‘Site List’ instead.
Notices about the server sit above the cards. Depending on the server, they can include a prompt to finish installing the app you chose when you created the server, an alert about a service that needs attention, an offer to move the server to lifetime billing when your team has a lifetime package available, or a note that Docker apps are ready for the server.
Step 2: Check Resource Usage and Server Profile
The top row tells you how busy the server is and what it is.
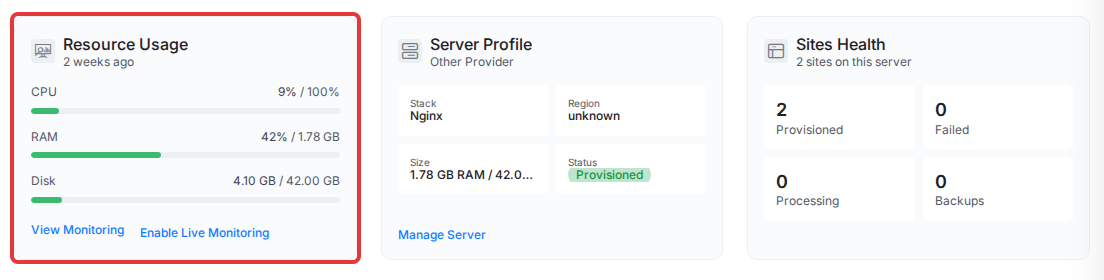
Resource Usage shows CPU, RAM and Disk as bars, with the total RAM and disk size beside each value. The subtitle shows when the server last reported; a server that never reported shows “Never checked” and -- values. A bar turns yellow at 50% and red at 90%.
- View Monitoring opens the server’s full monitoring page with its history.
- Enable Live Monitoring shows live CPU, RAM and disk usage in the server header, refreshed every 5 seconds while the page is open. See Live Server Monitoring.
Server Profile shows the provider in its subtitle and four tiles: Stack (for example Nginx or OpenLiteSpeed), Region, Size and Status. When a server has no plan size, for example a server you connected yourself, Size shows its RAM and disk totals. Manage Server opens the server’s management settings.
Sites Health counts the sites on the server:
| Tile | What it counts |
|---|---|
| Provisioned | Sites that finished setting up and are running |
| Failed | Sites whose provisioning or last update failed; highlighted when above zero |
| Processing | Sites that are being created or are waiting in the queue |
| Backups | Sites with automatic backups turned on |
To compare these numbers across all your servers at once, use xCloud Monitoring.
Step 3: Check Services Health and Security & Access
The second row shows whether the server’s software is running and how it is protected.
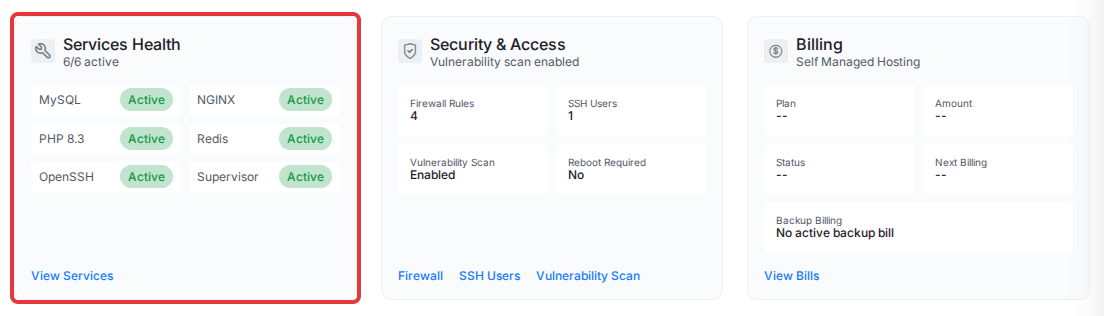
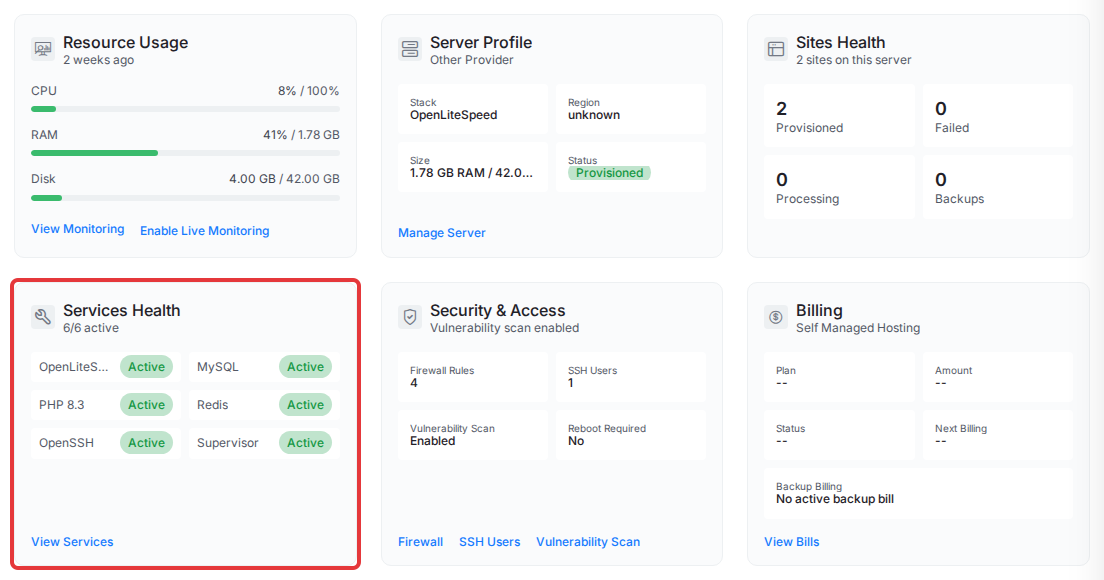
Services Health lists the services xCloud manages on the server, such as MySQL, NGINX or OpenLiteSpeed, PHP, Redis, OpenSSH and Supervisor, each with its status. The subtitle counts how many are active, for example 6/6 active. A failed service is listed first so you see problems before healthy services.
To restart, disable or install a service, click View Services. It opens the services list under ‘Management’ → ‘Settings’, which lets you restart or disable each service and install new services and packages. See How to Manage Services on Your Server.
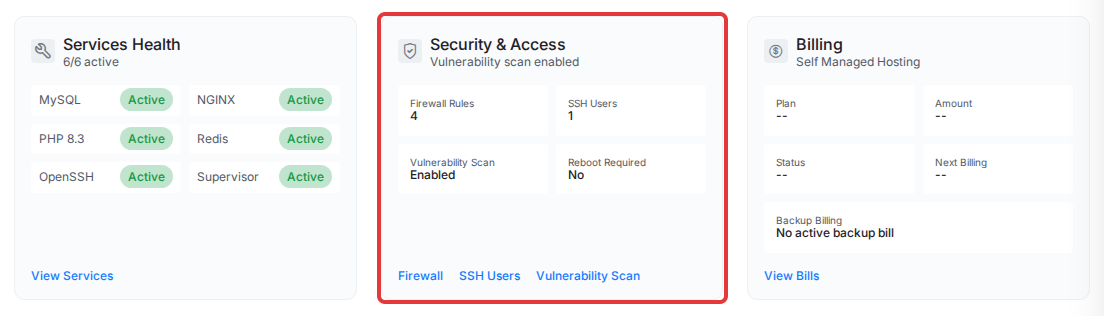
Security & Access has four tiles:
- Firewall Rules: the number of firewall rules on the server. The Firewall link opens Firewall Management.
- SSH Users: the number of sudo users. The SSH Users link opens the user list; see Sudo Users and Site Users.
- Vulnerability Scan: Enabled or Disabled. The Vulnerability Scan link appears on servers with PHP; see Vulnerability Checker.
- Reboot Required: Yes when a security update needs a reboot to take effect. The card’s subtitle then reads “Reboot required”.
When the Reboot Required notice appears
When an installed update needs a restart, xCloud shows a Reboot Required notice on the server’s pages with three actions:
- Reboot Now installs pending security updates, then restarts the server if a restart is still needed. Test your sites after the reboot.
- Skip hides the notice for 3, 7 or 30 days, or permanently with Always Skip.
- Configure Auto Reboot opens the server’s Security Update settings.
The notice stays hidden for the first 12 hours after a server is created. If Automatic Reboot is on, xCloud reboots the server on its schedule and shows the notice only on the Security Update page. To learn what the updates cover, read How Automated Security Updates and Auto Reboot Work.
Step 4: Check Billing
Billing sits at the end of the second row. Its subtitle names the hosting service the server is billed under, such as Self Managed Hosting, or “No active server bill”. The tiles show the Plan, the Amount with its renewal period, the bill Status and the Next Billing date.
A Billed tile appears when the billed amount differs from the amount you pay, for example when credit or an advance payment covers part of it. Backup Billing shows the server’s backup bill, or “No active backup bill”. Click View Bills for the server’s full bill history.
Step 5: Check Runtime & Automation and use Quick Actions
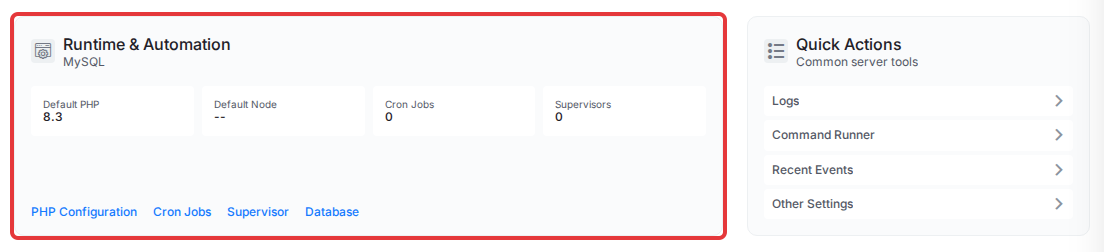
Runtime & Automation shows the server’s database in its subtitle and four tiles:
- Default PHP and Default Node: the server’s default PHP and Node.js versions.
--means none is set. Plain servers do not show these tiles. - Cron Jobs: the number of server cron jobs. See How to Configure a Cron Job.
- Supervisors: the number of Supervisor processes. See Supervisor for Process Management.
The links under the tiles (PHP Configuration, Node Configuration, Cron Jobs, Supervisor and Database) appear only when the server runs that software.
Quick Actions links to four common server tools: Logs, Command Runner, Recent Events and Other Settings.
Step 6: Review Team Access and Recent Sites
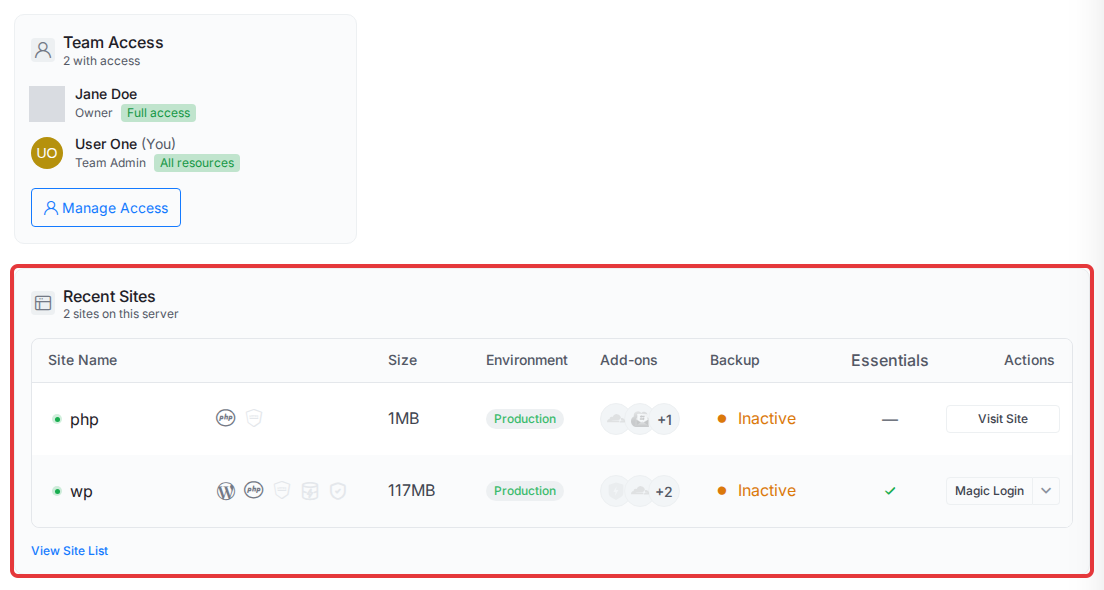
Team Access lists who on your team can open this server and their access level. Click Manage Access to add or remove a member. You see this card if your role can manage team access; see How to Manage Team Access to a Server or Site.
Recent Sites lists up to five sites on the server with their size, environment, add-ons, backup state and site actions such as Visit Site or Magic Login. When the server has more than five sites, the subtitle reads “Showing 5 of N sites” and View All Sites opens the full list. A Plain server hosts no sites, so this card is replaced by a prompt to install a web server.
The Overview on an OpenLiteSpeed server
An OpenLiteSpeed server shows the same cards. The differences are in the values: Stack reads OpenLiteSpeed and Services Health lists OpenLiteSpeed in place of NGINX.
What you see depends on your role and stack
Every link on the Overview uses the same permission check as the server menu, so a link you cannot open is hidden rather than leading to an error. A member whose role cannot manage the firewall, for example, does not see the Firewall link. Cards also follow the server’s stack: a Plain server has no Sites Health card, and the Runtime & Automation card appears only on servers with PHP, Node.js or Supervisor.
If deleting a server or a site on it gets stuck or shows a failed status, see Why a Site or Server Deletion Hangs, and How to Finish It Safely.
Frequently asked questions
Why does Resource Usage show dashes instead of a percentage?
The server has not reported monitoring data yet, for example a Plain server, which runs no monitoring. xCloud shows dashes rather than 0% so an unknown value never looks like an idle server. The card’s subtitle shows “Never checked” in that case.
What counts as a Failed site on the Sites Health card?
A site whose provisioning failed or whose last update failed. The Failed tile is highlighted when the count is above zero. Sites that are still being created or are waiting in the queue are counted under Processing instead.
Why don’t I see some cards or links on my Overview?
The Overview hides what does not apply to your server or your role. A Plain server has no Sites Health card or PHP and Node runtime tiles, the Vulnerability Scan link needs a server with PHP, and each link only appears when your team role can open that page.
Does Reboot Required mean xCloud will reboot my server?
Only if Automatic Reboot is turned on for the server. Otherwise the server waits until you choose Reboot Now in the Reboot Required notice, or reboot it yourself.
If you run into any issues with the server Overview, feel free to reach out to our support team.