The htop command is a user-friendly, interactive tool that provides a real-time view of your system’s performance, particularly processes, CPU, and memory usage. It is more visually intuitive compared to the top command, with its color-coded display and easy-to-use keyboard shortcuts.
In this guide, we will cover two methods on how to use htop to monitor and troubleshoot system processes, including MySQL resource usage and website traffic management. We have also incorporated the ability to restart MySQL or the server through the xCloud dashboard.
What You Can Monitor with htop: #
When you launch htop, you gain access to critical system metrics that can help diagnose performance issues:
- CPU Usage: Displayed for individual cores, showing the load each is handling.
- Memory Usage: Details on how your RAM is being used, including buffers and caches.
- Swap Usage: Displays swap memory, which is disk space used as virtual RAM.
- Process Count: Shows the number of tasks, threads, and active processes.
- Load Averages: Provides 1, 5, and 15-minute averages of CPU load.
- System Uptime: Shows how long the server has been running.
- Active Processes: Displays details such as process ID (PID), user, memory, and CPU usage for each process.
Method 1: Monitoring MySQL Processes And System Resources Using htop #
In this method, you will explore how to monitor website activity and analyze system resources through the htop command. This comprehensive approach will guide you in identifying traffic patterns, managing server performance, and addressing issues related to plugins or themes that may affect your website’s operation.
Step 1: Connect to Your Server Via SSH #
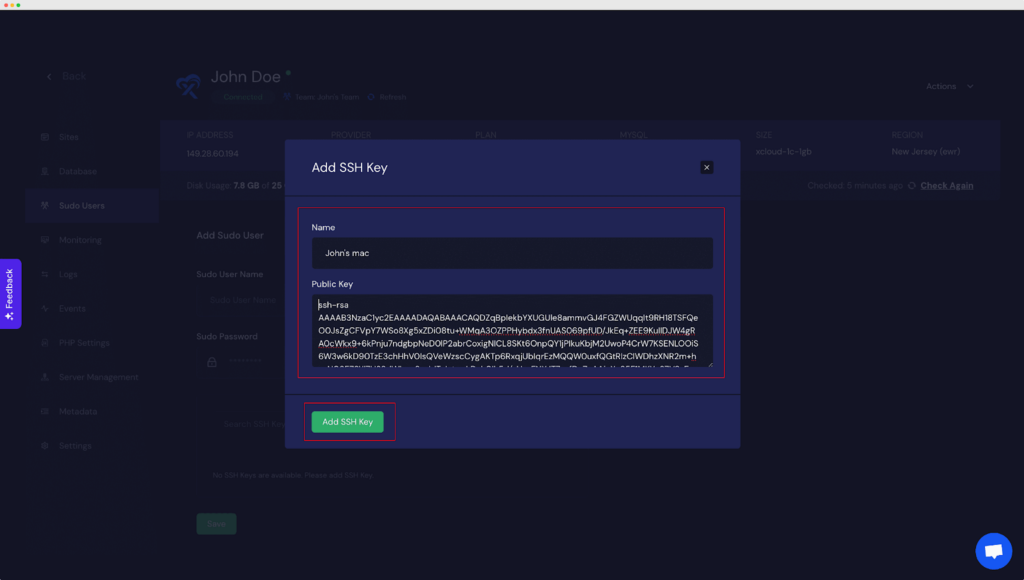
First, you have to create sudo users with sudo access to run commands as the root user, helping you manage the server effectively. To create sudo users and connect your server via SSH, read this documentation: Understanding Sudo Users And Site Users In xCloud.
Step 2: Run the htop Command #
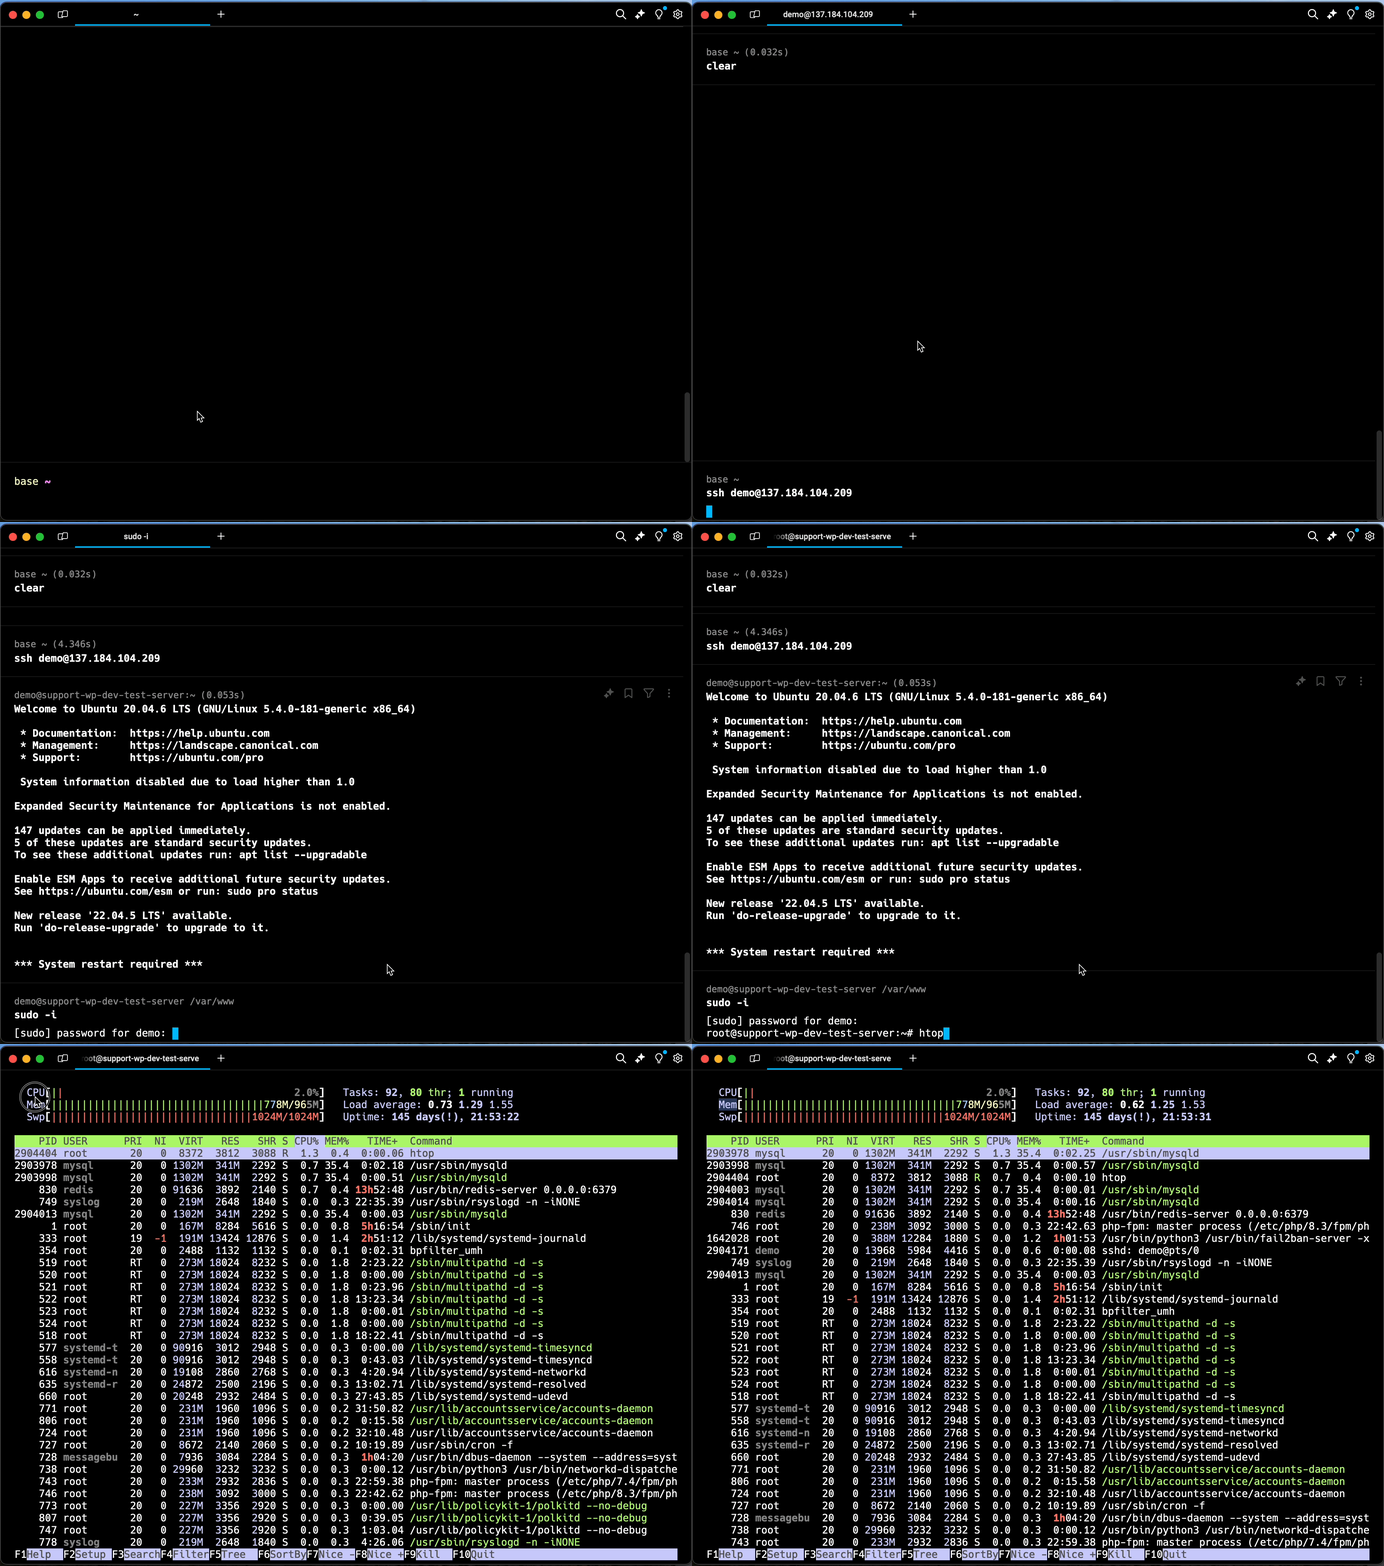
Once connected to your server, type htop in the terminal and press Enter. The htop interface will open, displaying real-time system metrics like CPU usage, memory, swap usage, and active processes.
Step 3: Navigating htop #
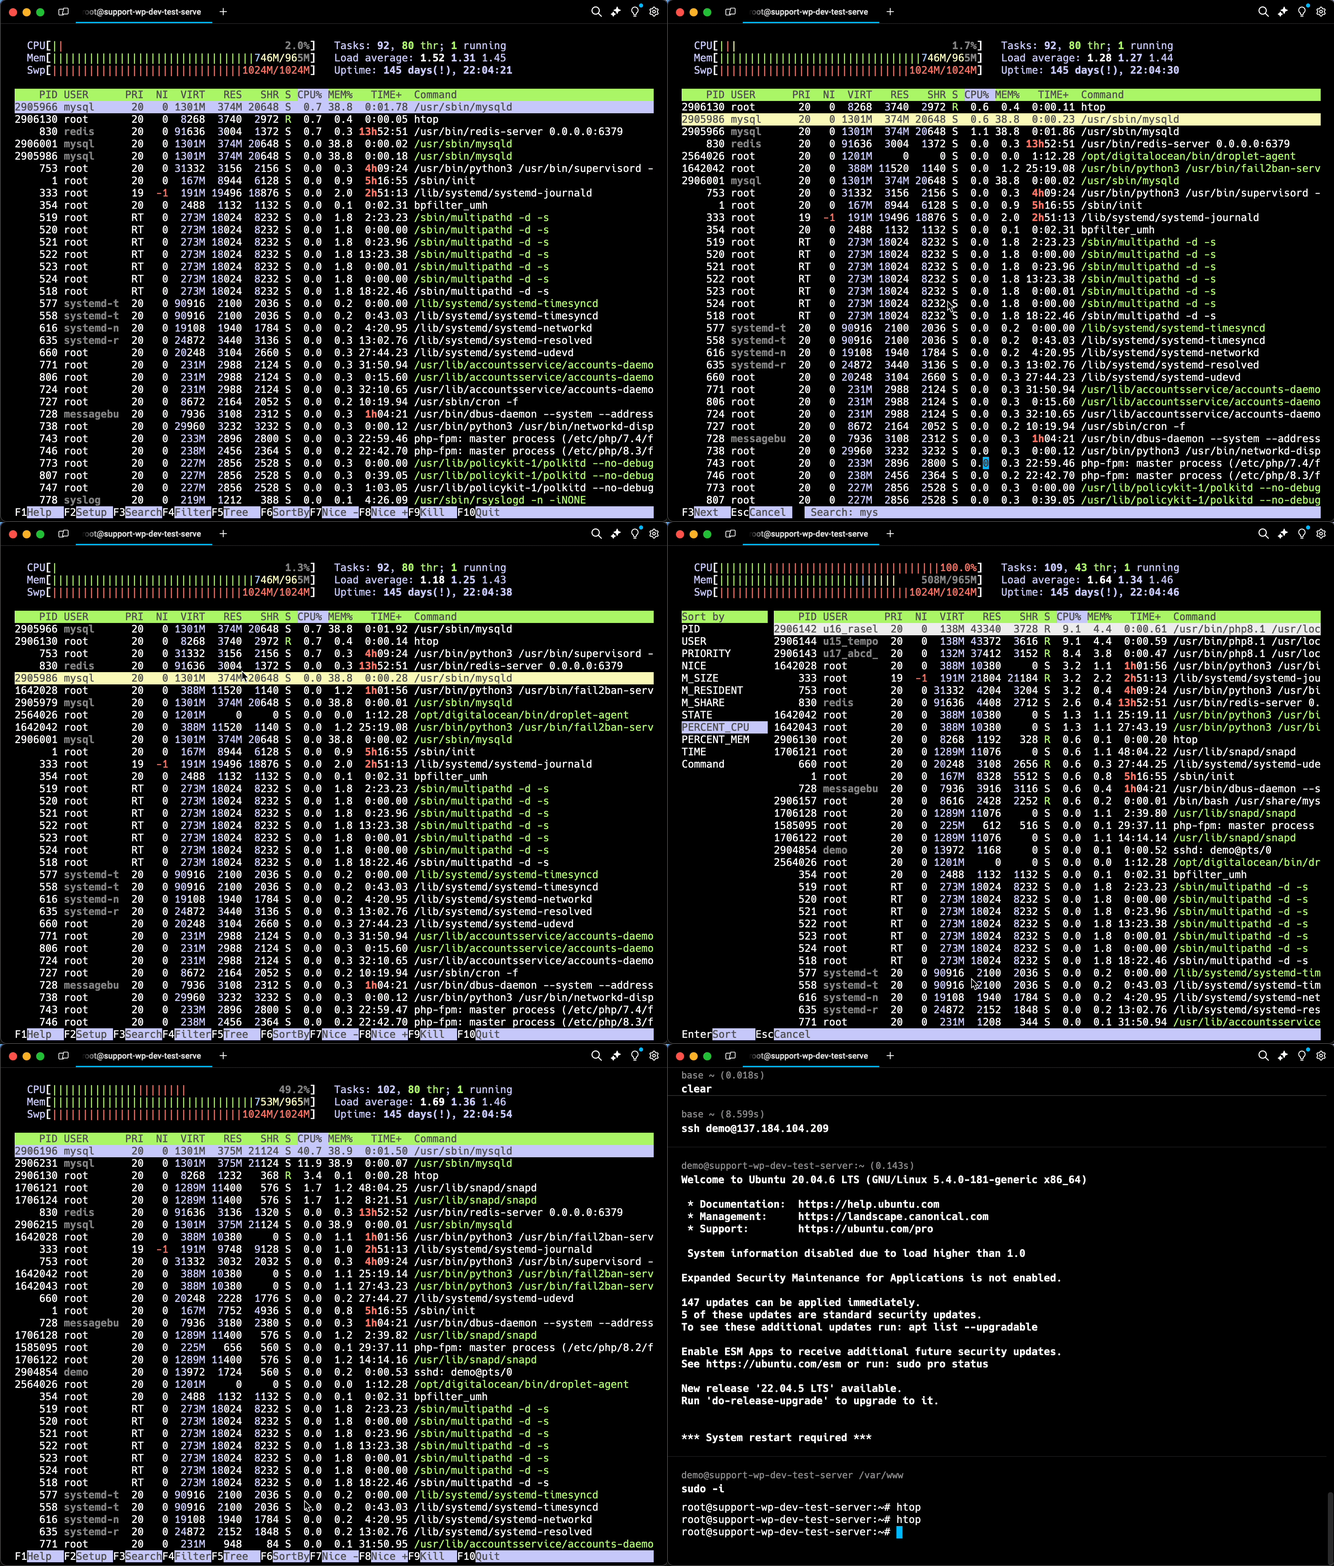
You can interact with the htop interface using keyboard shortcuts. Press F3 to search for specific processes (for example, type “mysql”), F6 to sort by CPU, memory, or other metrics, F9 to kill a specific process, and F10 to exit htop.
Step 4: Access Database Details via xCloud Dashboard #
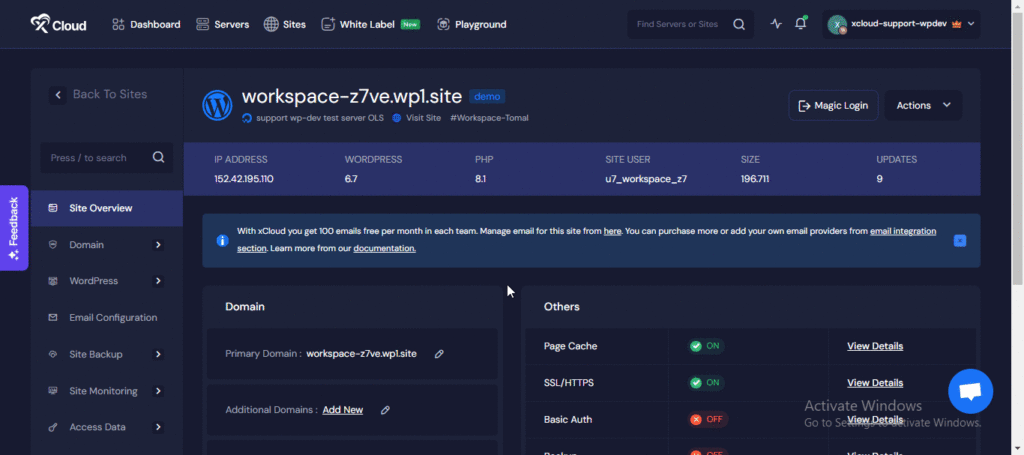
To monitor database activity more effectively, log in to the xCloud dashboard and navigate to your site and find Access Data → SFTP option from the menu. Here, you can find details about where to access the database for the site.
Note: During server provisioning, we send the root password for the database/MySQL to your email. Use these credentials to access and manage the database as needed.
Step 5: Check MySQL Resource Usage #
In the htop interface, search for MySQL processes. Use the F3 key to quickly locate them by typing “mysql” in the search bar. If you notice high CPU or RAM consumption, there may be problematic MySQL queries or table locking issues.
Step 6: Check Active MySQL Queries #
To check active MySQL queries, open a new terminal session and log into MySQL using the command mysql -u root -p. Then, use the following command to inspect active queries:
SHOW PROCESSLIST;
This will help identify queries causing high resource usage, such as long-running or sleeping queries.
Step 7: Kill Problematic Queries #
If a query is causing high resource consumption, use the KILL command with the specific query ID:
KILL QUERY_ID;
Step 8: Restart MySQL or Server #
If killing problematic queries does not resolve the issue, you may need to restart MySQL or the server. To restart MySQL from the command line, use the command
sudo systemctl restart mysql
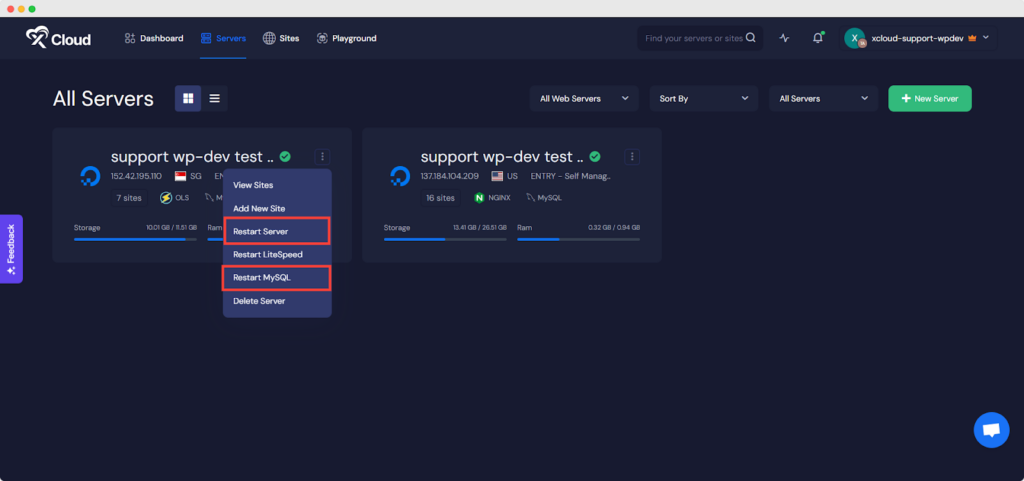
Alternatively, you can restart MySQL or the server directly from the xCloud dashboard. Log in to the dashboard, click the three-dot menu, and select ‘Restart MySQL’ or ‘Restart Server’. After restarting, use htop again to check CPU and memory usage to ensure everything is back to normal.
Method 2: Monitoring Website Activity And System Resources Using htop #
In this method, you will explore how to monitor website activity and analyze system resources through the htop command. This comprehensive approach will guide you in identifying traffic patterns, managing server performance, and addressing issues related to plugins or themes that may affect your website’s operation.
Step 1: Use htop to Monitor Website Performance #
Open htop and monitor processes related to your website, such as apache2, nginx, or php-fpm. Log into xCloud and go to the specific site’s page. Locate the ‘Site User’ field in the site details bar. In htop, you can find the processes associated with your web server (for example, nginx, apache2, or php-fpm). If the processes are running under a specific site user, log into the xCloud dashboard and navigate to the website in question. Look for the ‘Site User’ in the site’s details.
Step 2: Check Site Traffic and System Resource Usage #
If CPU or RAM usage is high, check the website traffic to see if a sudden surge is causing the issue. To check the traffic, visit the logs in the xCloud dashboard. Navigate to the site and go to Monitoring and Logs. If your server is an NGINX server, choose the NGINX access logs, or if your server is an OLS server, select the OLS access logs. Review the traffic patterns. If you see legitimate high traffic, consider upgrading your hosting plan. If the traffic seems suspicious, it may indicate a potential bot attack that needs attention.
Step 3: Filter Bot Traffic #
If bot traffic is overwhelming your server, enable the 7G Firewall and 8G Firewall, a lightweight firewall that blocks bots and malicious traffic. You can also enable Cloudflare’s ‘Under Attack Mode’ in your Cloudflare settings to protect against DDoS attacks.
Step 4: Check Plugins, Themes, and MySQL Processes #
Sometimes, plugins or themes can cause excessive resource usage. To troubleshoot this, ensure everything is up-to-date by updating your plugins and themes. Additionally, consider disabling non-essential plugins, as reducing the number of active plugins may improve performance. You can also check MySQL queries by following the steps in Method 1 to identify any problematic queries.
Step 5: Restart the Server Using the xCloud Dashboard #
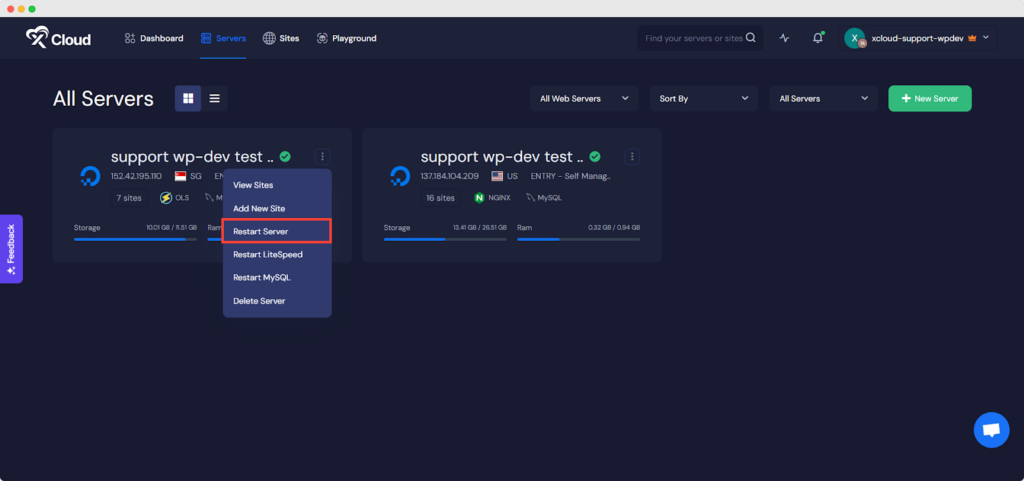
If traffic issues or plugin problems persist, you can reboot the server using the xCloud dashboard. Simply go to the xCloud dashboard, find your server, click the three-dot icon, and select Restart Server.
That’s it. By following this guide, you can efficiently monitor and troubleshoot system processes using htop. From MySQL queries to web traffic and plugin management, htop combined with xCloud dashboard functionalities provides a comprehensive toolkit for maintaining server performance. The inclusion of color-coded visual metrics in htop and easy keyboard navigation further enhances the user experience and simplifies the troubleshooting process.
Still stuck? Contact our support team for any of your queries.


