


Monitoring server resources is very important to ensure smooth performance and prevent downtime. By keeping an eye on RAM, CPU, and disk usage, you can identify potential issues before they affect your applications or websites. With xCloud, you can easily monitor these server resources through a user-friendly dashboard.
Learn from the step-by-step guide below to monitor server resource usage easily with xCloud.
Step 1: Go to the Server Dashboard #
From your xCloud dashboard, select the site you want to monitor. You can also go to the ‘Servers’ tab, click on the specific server, and then select ‘Monitoring’ from the sidebar.

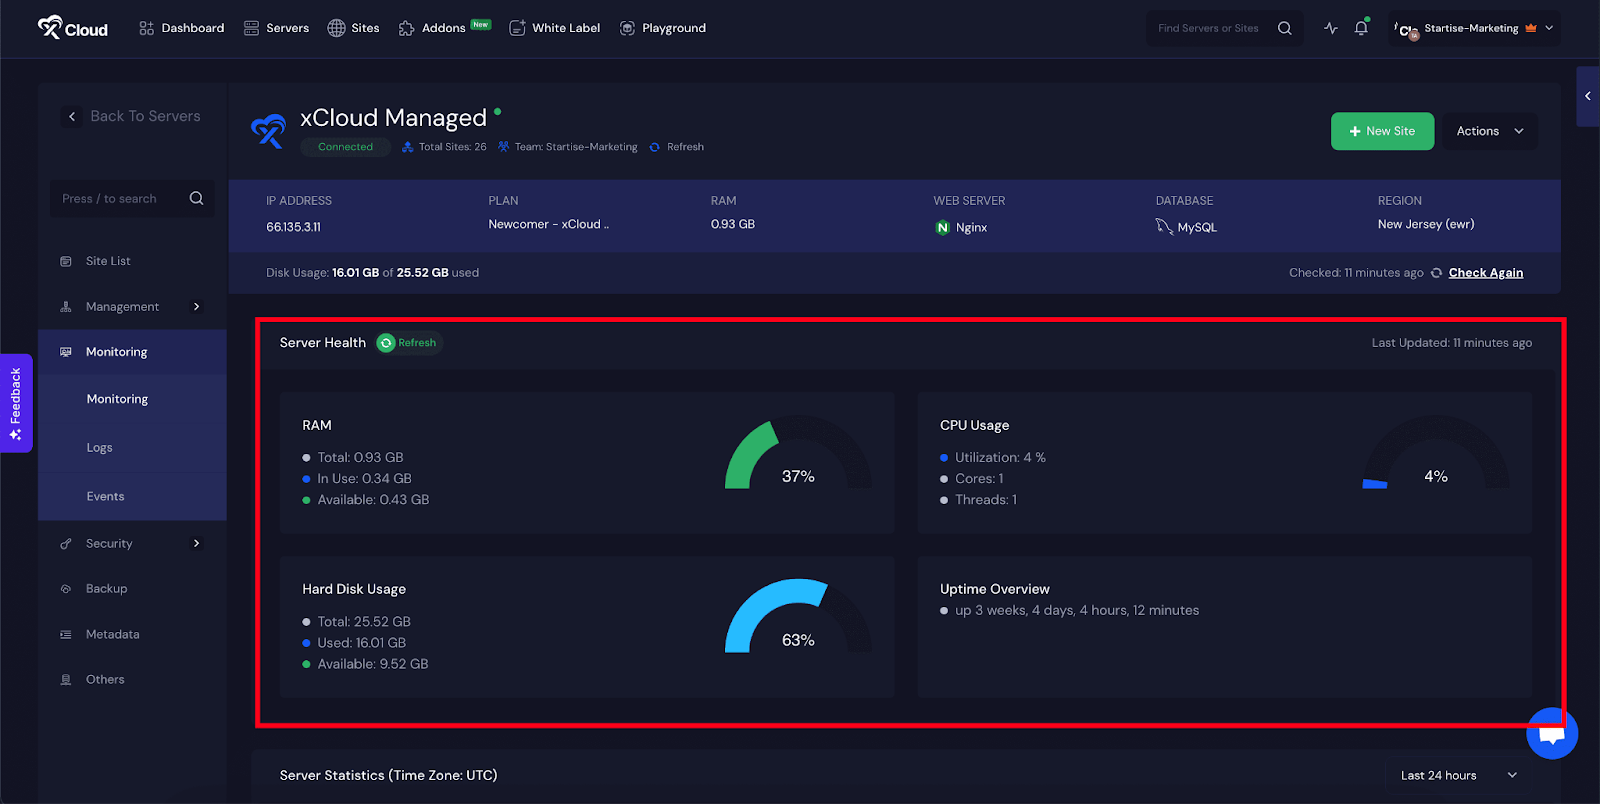
Step 2: Check the Usage Statuses #
Here, you will see the complete status of the RAM, CPU, Disk usage, and Uptime Overview of the server.
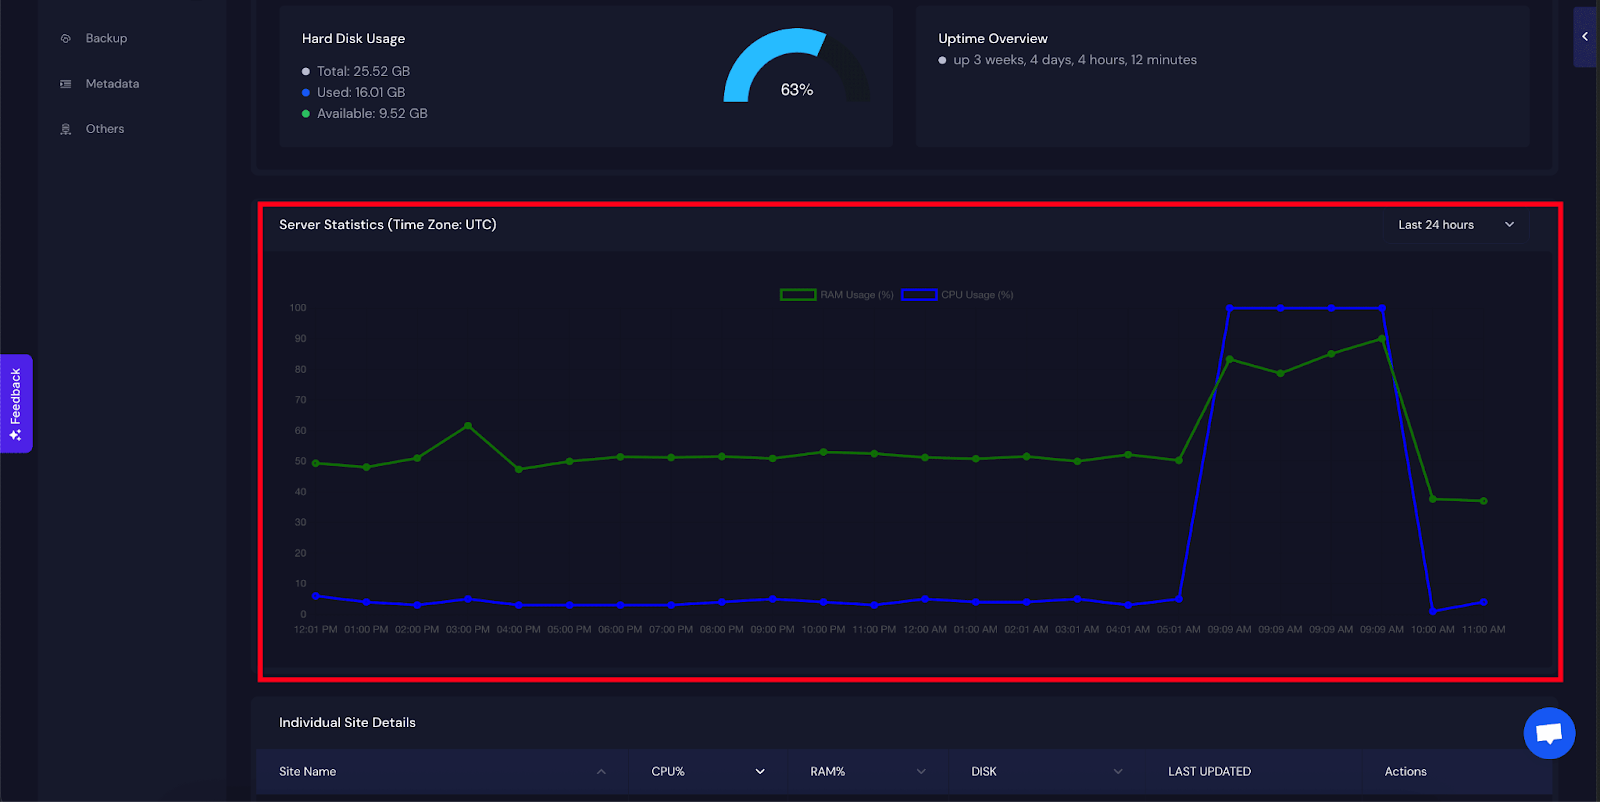
Next, go to the Server Statistics (Time Zone UTC) section to check server usage over a specific timeframe. You can change the filter from Last 24 Hours or Last 7 Days to get a more customized view.
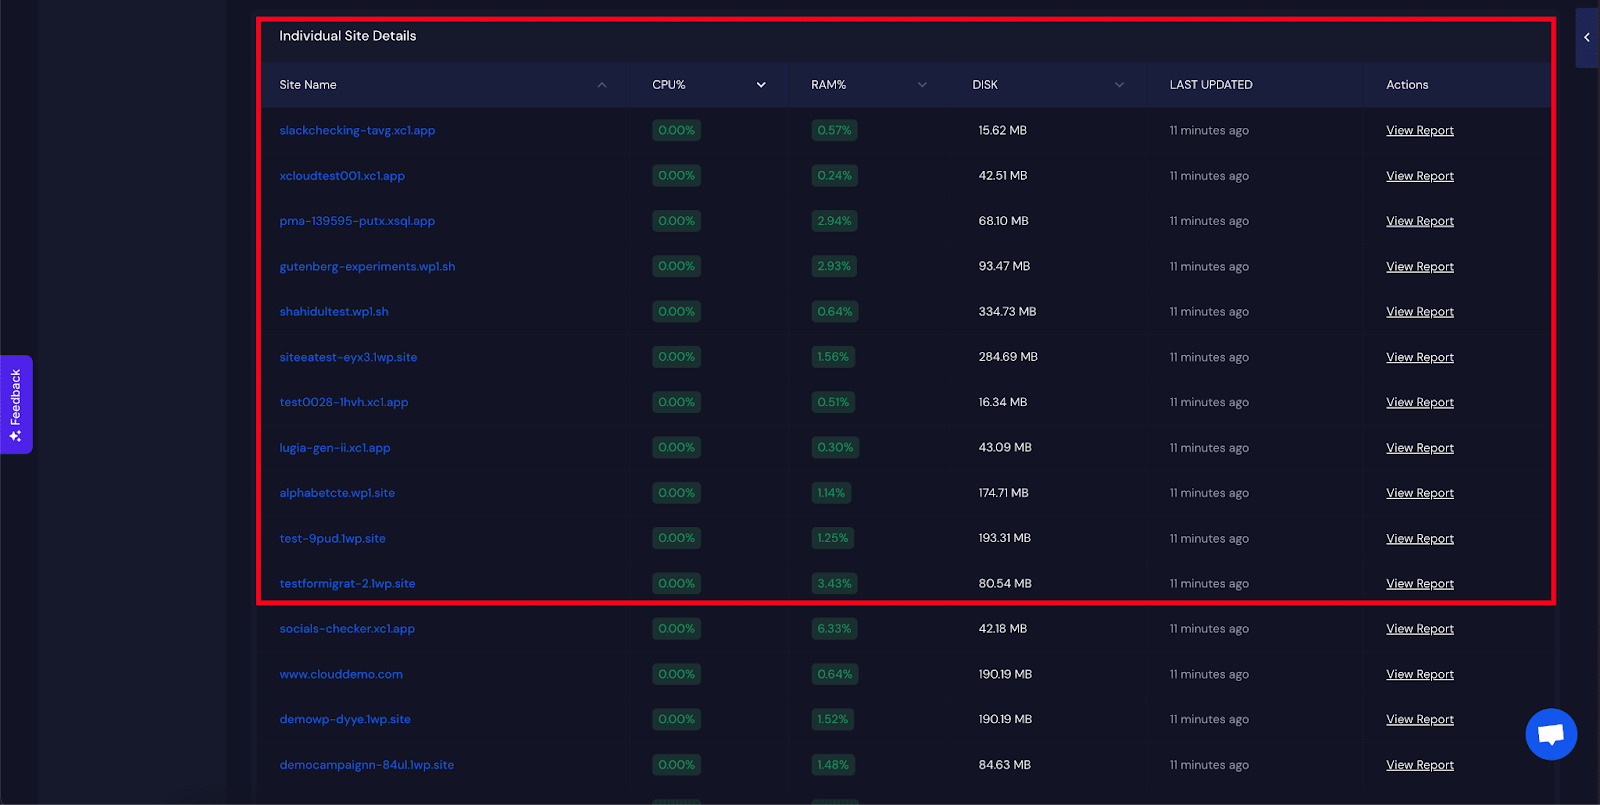
After that, go to the Individual Site Details section to view server resource usage for all sites created inside the server separately. You can click on the View Report button for more details about a specific site.
Next, head to the Top CPU Usage Process section to see which process is using the most CPU.
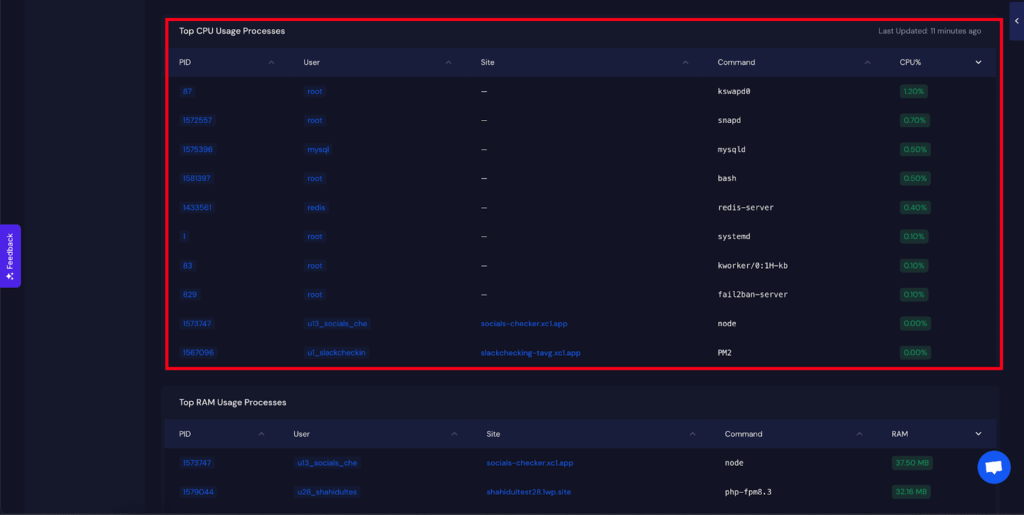
Similarly, go to the Top RAM Usage Process section to check which process is consuming the most RAM.

Finally, go to the Largest Files & Folders section and click on the Scan Now button to identify files or folders that are using the most server resources.

By following these steps, you can easily monitor the RAM, CPU, and Disk usage of your server with xCloud. Regular monitoring helps you maintain server health, optimize performance, and prevent resource overload. If you need further assistance, feel free to contact our support team for help.


