


Website performance plays a key role in user experience and search engine ranking. A slow site can push visitors away, while a fast site helps you keep them engaged. Page Speed Insights on xCloud gives you a clear view of how your website performs and highlights issues that need fixing.
By using it, you can improve speed, accessibility, best practices, and SEO, which are all important for growth. To ensure you fully leverage this tool, it is essential to learn how to access Page Speed Insights effectively.
Follow the steps below to access Page Speed Insights on xCloud and optimize your website for better performance in just a few clicks:
Step 1: Access Page Speed Insights #
First, go to your site dashboard, then navigate to the ‘Monitoring’ option from the sidebar menu, and then click on the ‘Page Speed’ from the menu.
Step 2: Review Site Performance Graphs #
In this section, you will see the ‘Site Performance’ area displayed as a graph. This graph shows your site’s overall scores for ‘Performance’, ‘Accessibility’, ‘Best Practices’, and ‘SEO’. These scores help you quickly understand how well your site is functioning in terms of speed, usability, coding quality, and search optimization.
- Performance: Measures how fast and responsive your website is.
- Accessibility: Checks if your site is easy to use for everyone, including people with disabilities.
- Best Practices: Reviews whether your site follows safe and modern coding standards.
- SEO: Look at how well your site is prepared to rank in search engines.
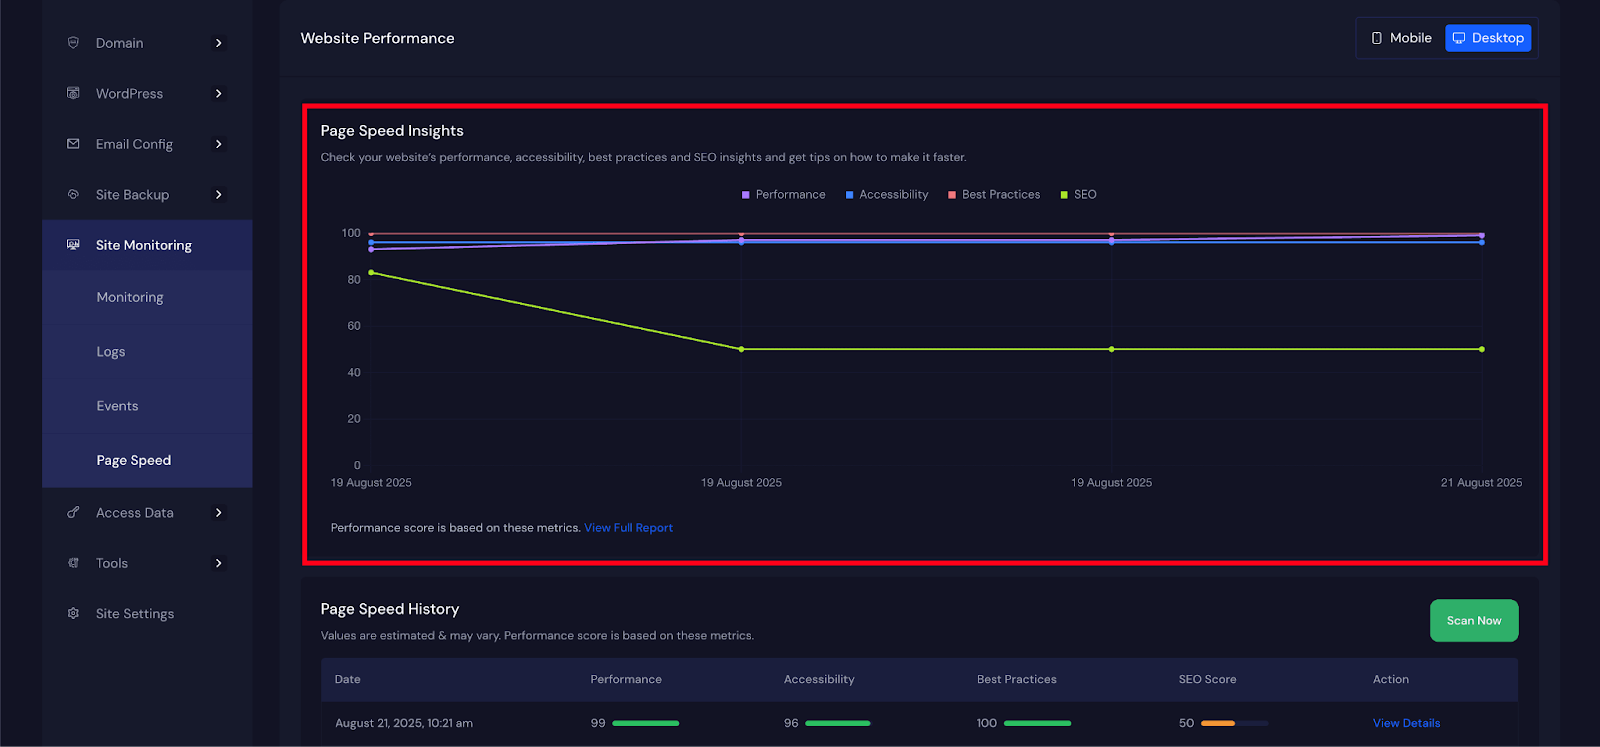
Step 3: Switch Between Mobile and Desktop Views #
At the top right corner of the performance section, you will find buttons labeled ‘Mobile’ and ‘Desktop’. By switching between these options, you can view how your site performs on different devices.
Step 4: Explore Page Speed History #
When you scroll down, you will come across the ‘Page Speed History’ section. This area stores the historical data of your site’s performance. By reviewing it, you can track whether the improvements you made in the past have had a positive effect on your site’s health over time. Also, click on the ‘Analyze Now’ button to get the latest results instantly.
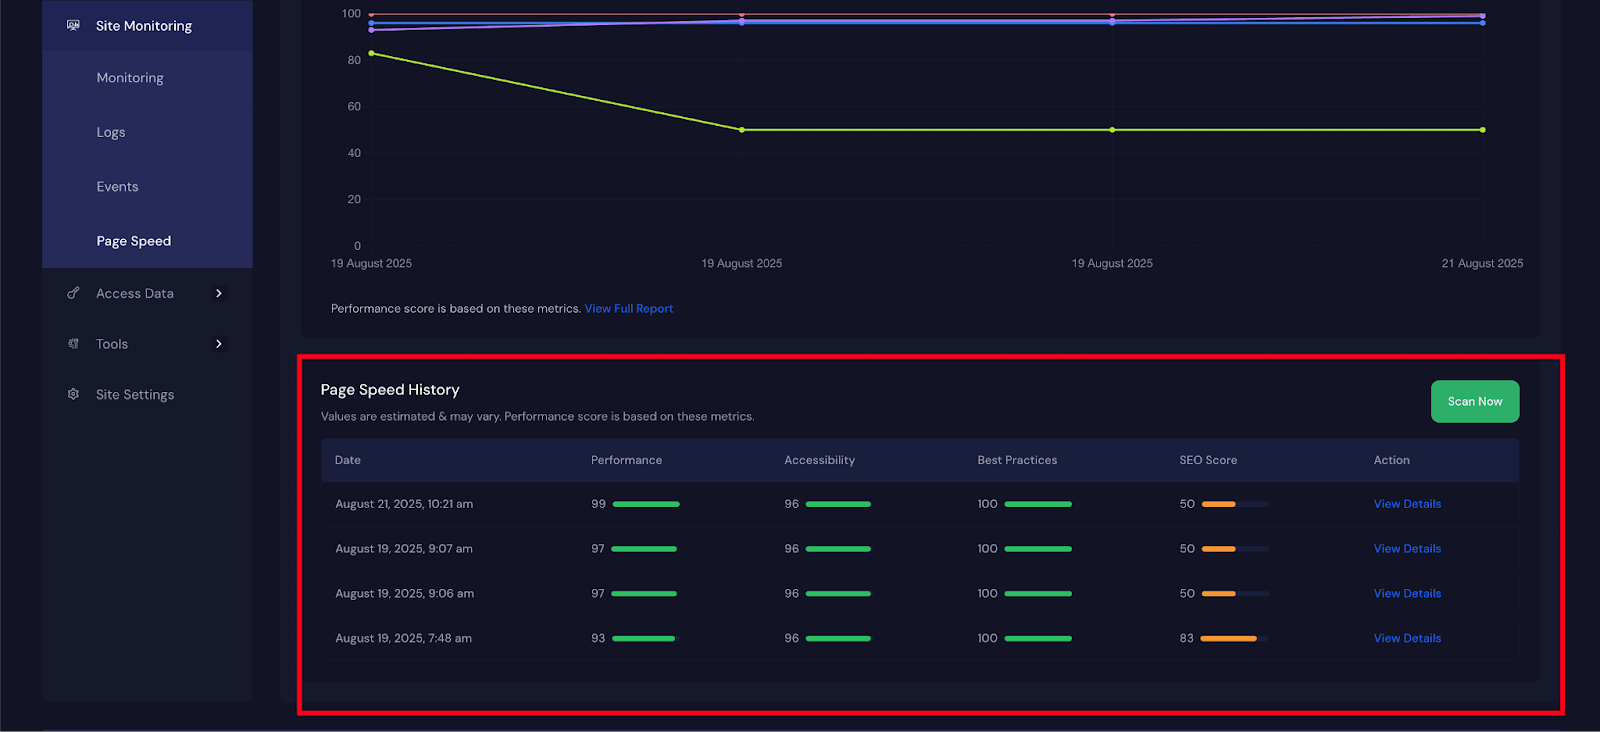
Step 5: Check Detailed Reports #
For deeper analysis, click on the ‘View Details’ link. Here, you will find a detailed breakdown of your site’s scores in ‘Performance’, ‘Accessibility’, ‘Best Practices’, and ‘SEO’. These results give you a clear view of which areas are strong and which need more attention.
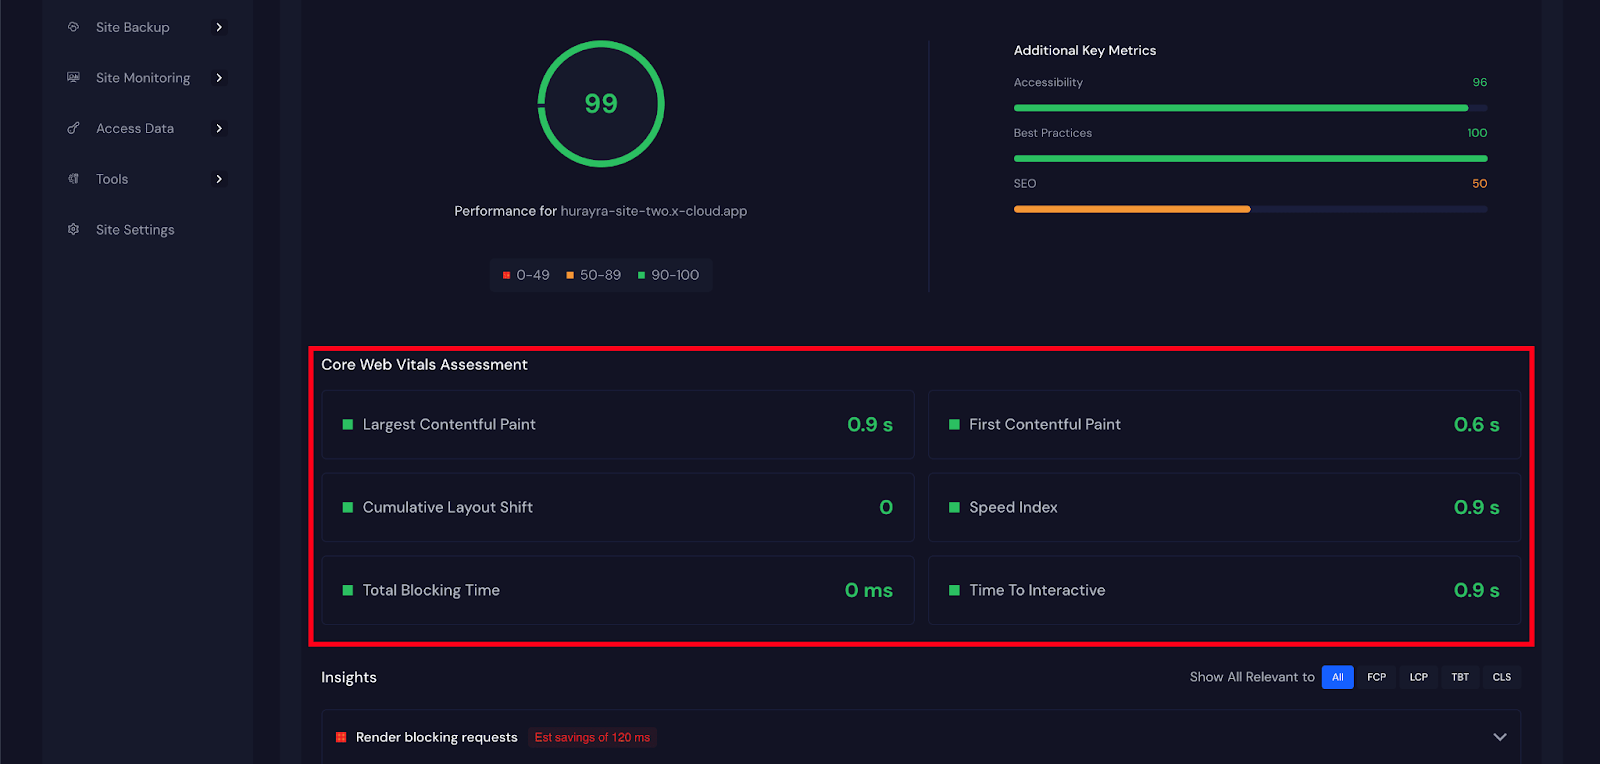
Step 6: Review Core Web Vitals #
You can also review the ‘Core Web Vitals Assessment’, which highlights vital elements that reflect real-world user experience. These include ‘Speed Index’, ‘Time To Interactive’, ‘Total Blocking Time’, ‘First Contentful Paint’, ‘Cumulative Layout Shift’, and ‘Largest Contentful Paint’. These metrics show you exactly how users experience your website in terms of speed, responsiveness, and stability while it loads.
- Speed Index: Tells how fast the visible content on your page appears while it loads. A lower value means the page looks ready sooner.
- Time To Interactive: Shows how long it takes before users can fully interact with the page without delays.
- Total Blocking Time: Measures the time when the page cannot respond because scripts are blocking it.
- First Contentful Paint: Marks the moment when the first text or image appears on the screen.
- Cumulative Layout Shift: Tracks how much the page layout moves around as it loads. Less shifting means a smoother experience.
- Largest Contentful Paint: Records how long it takes for the main piece of content, like a large image or text block, to appear.
Step 7: Use Insights and Diagnostics #
Finally, at the bottom of the report, you will find ‘Insights’ and ‘Diagnostics’. Insights identify the major issues that may be slowing down your website, while diagnostics provide clear recommendations to fix those problems.
For example, you might be advised to reduce unused CSS or JavaScript, compress large images, improve server response times, or enable caching. By following these suggestions, you can significantly improve the overall performance of your site.
And that is it, this is how easily you can monitor your site regularly, create a website that is fast, user-friendly, and search engine optimized. This not only enhances the experience for your visitors but also increases your chances of ranking higher and staying competitive online.
Still stuck? Contact our support team for any of your queries.


