


Website performance directly affects user satisfaction, retention and search rankings. Even small delays in page load time can lead to higher bounce rates, lower conversions and weaker SEO visibility.
Site Insights on xCloud gives you real-time data across three areas: PHP activity, MySQL operations and traffic patterns so you can find and fix issues fast.
- Traffic: Displays overall traffic summary (requests, unique IPs/URLs, bot requests, bandwidth), along with IP Requests, Bot Traffic, URL Requests, Status Codes, and Bandwidth Usage per URL.
- PHP: Shows top requested pages, live PHP-FPM processes (PID, CPU %, Memory %, state, command) and slow pages with PHP-FPM slow log configuration and entries.
- MySQL: Provides a summary (connections, threads, uptime, QPS, buffer pool, slow and aborted queries), Active Connections, All Queries, Running Queries and Slow Query Log configuration and entries
Follow the steps below to access Site Insights from your xCloud dashboard and learn how to read the PHP, MySQL, and traffic reports to monitor, diagnose and improve your website’s performance:
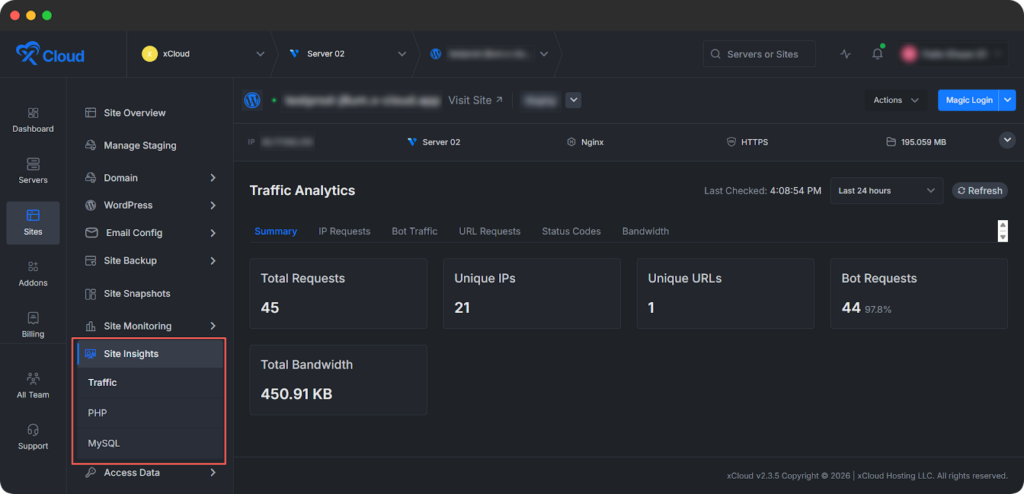
Step 1: Access Site Insights #
Log in to your xCloud account. From the dashboard, go to ‘Sites’ and select your site. Navigate to Site Insights in the sidebar menu, then click one of the three tabs: PHP, MySQL or Traffic. Use these tabs to view detailed performance data for your site.
Step 1: Check Traffic Insights #
Traffic Insights shows how visitors and bots interact with your site. It helps you distinguish normal traffic from suspicious patterns, understand demand, and control bandwidth usage.
Click the ‘Traffic’ option to access comprehensive insights into your site’s visitor patterns, bot activity, and resource consumption. This starts with an overall Summary dashboard, followed by dedicated tabs that break down data for precise analysis and optimization.
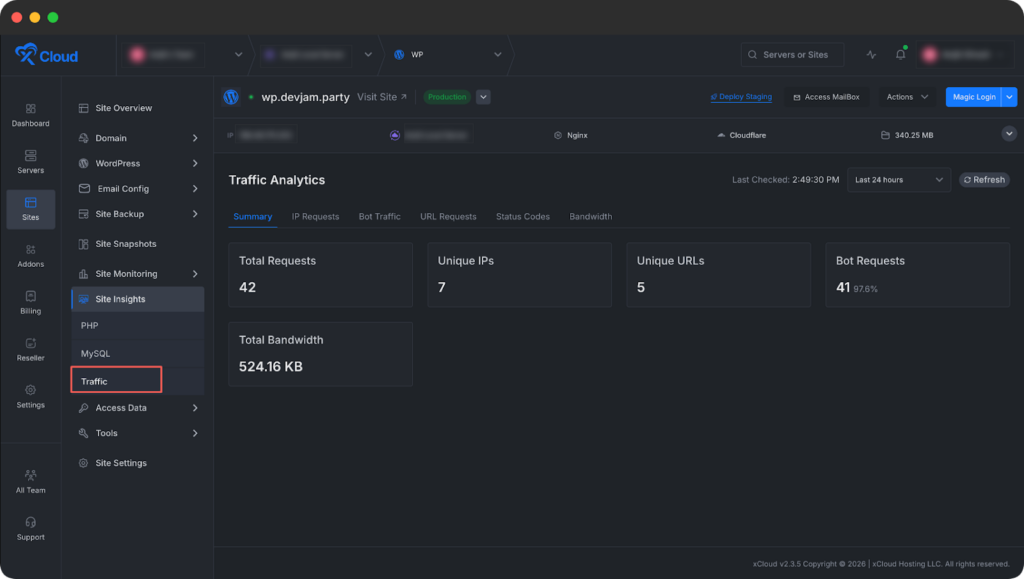
Summary #
Get an instant overview of site activity:
- Total Requests: Complete count of all incoming requests over the selected timeframe
- Unique IPs: Number of distinct IP addresses accessing your site, helping gauge real visitor reach
- Unique URLs: Count of individual pages or endpoints hit, revealing content popularity
- Bot Requests: Total automated traffic volume to separate human traffic from bots
- Total Bandwidth: Aggregate data transfer in MB/GB, important for cost and performance planning
Use this summary to quickly understand overall load, reach, and the balance between human and automated traffic.
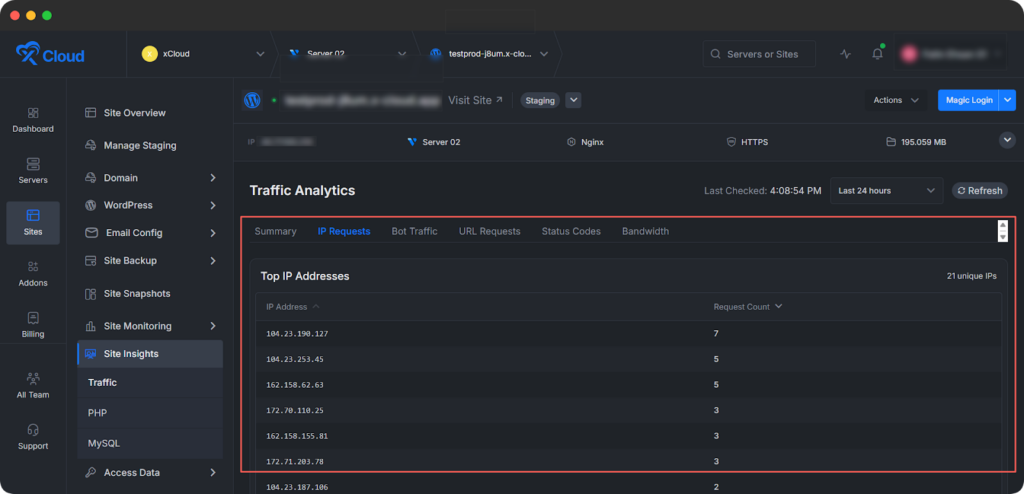
IP Requests #
The IP Requests view shows the top IP addresses driving traffic to your site, along with their request counts.
Go to this tab to identify heavy users, frequent crawlers, or suspicious endpoints. It helps you whitelist trusted sources, block abusive IPs, and investigate potential DDoS or scraping activity.
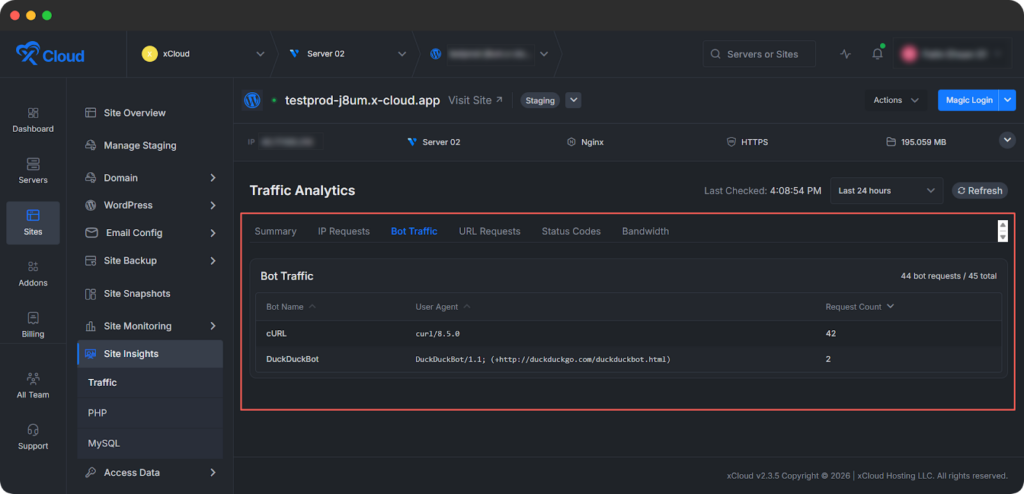
Bot Traffic #
The Bot Traffic section identifies automated visitors in detail, including:
- Bot Name: Recognized crawler or bot identifier (for example Googlebot, Bingbot)
- User Agent: Full browser or agent string for verification
- Request Count: Hits per bot to monitor crawl frequency
Go to this tab to distinguish useful bots from noisy or unwanted crawlers, and to adjust your rules or robot configuration to reduce unnecessary load.
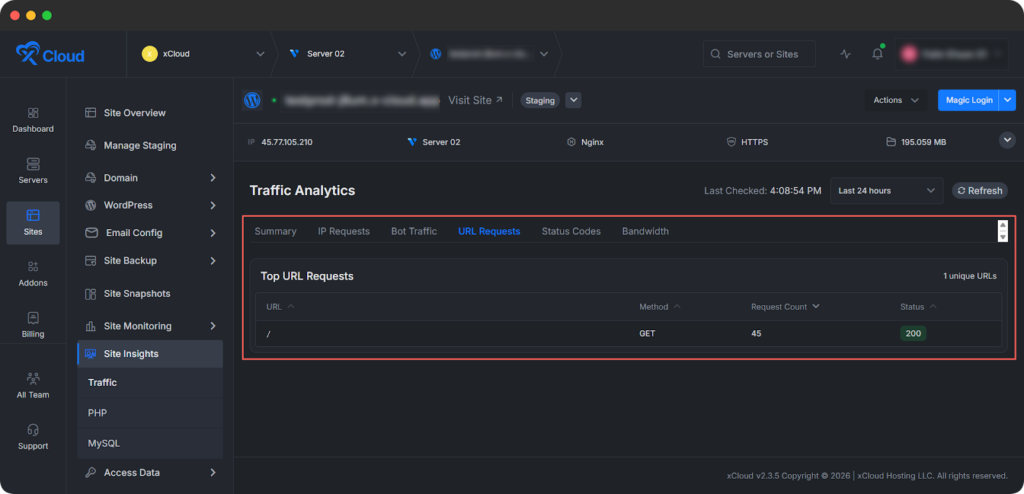
URL Requests #
The URL Requests section reveals your most-accessed endpoints, showing:
- Top URL Requests: Ranked list of pages or paths
- Method: HTTP method such as GET or POST
- Request Count: Total hits per URL
- Status: Response code (for example 200 OK, 500 Error, 401 Unauthorized)
Go to this tab to see which pages matter most, prioritize performance work on highly requested URLs, and quickly find endpoints that return frequent errors.
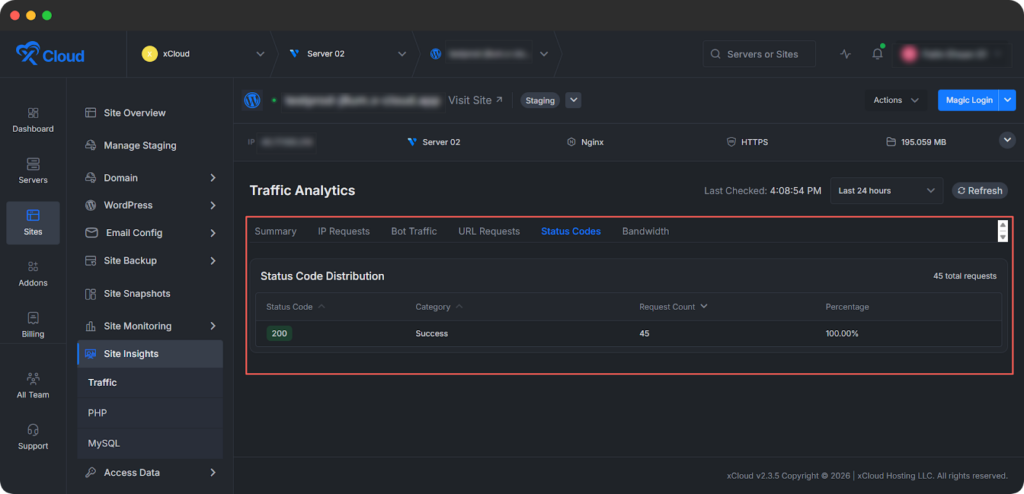
Status Codes #
The Status Codes view categorizes responses for health checks, including:
- Status Code: Specific code such as 200, 404, 503
- Category: Groups like 2xx Success, 4xx Client Error, 5xx Server Error
- Request Count: Occurrences per code
- Percentage: Proportion of total traffic for each status
Go to this tab to spot spikes in client or server errors and address issues before they significantly impact users.
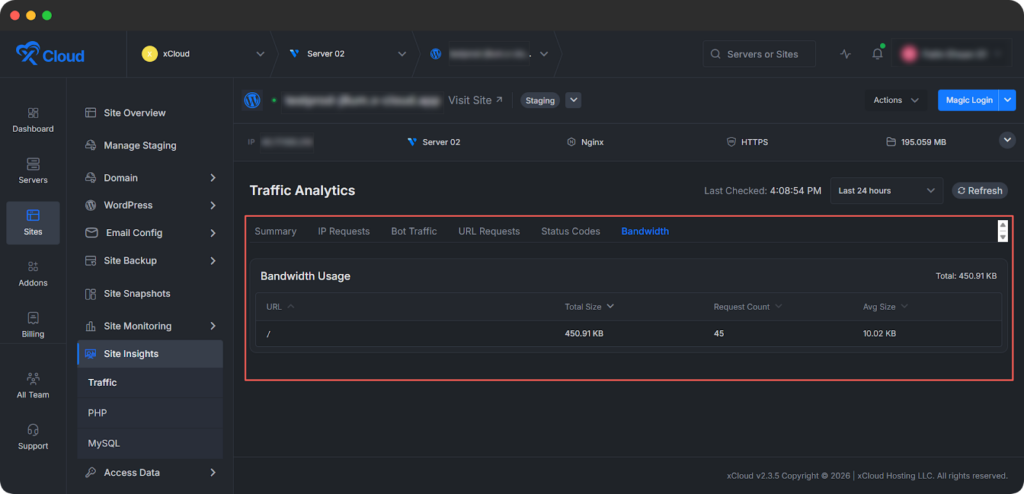
Bandwidth #
The Bandwidth section tracks data-heavy pages with metrics such as:
- URL: Specific endpoint
- Total Size: Cumulative bytes transferred
- Request Count: Number of requests contributing to usage
- Average Size: Average response size per request
Go to this tab to find pages or assets that consume a lot of bandwidth, then optimize media, caching, or response sizes to reduce costs and improve performance.
Step 3: Check PHP Insights #
Click the ‘PHP ’ option to access three essential insights into your site’s PHP performance: ‘Requested Pages’, ‘Running Processes’, and ‘Slow Pages’. These provide granular data to diagnose issues, optimize resource usage and ensure smooth operation.
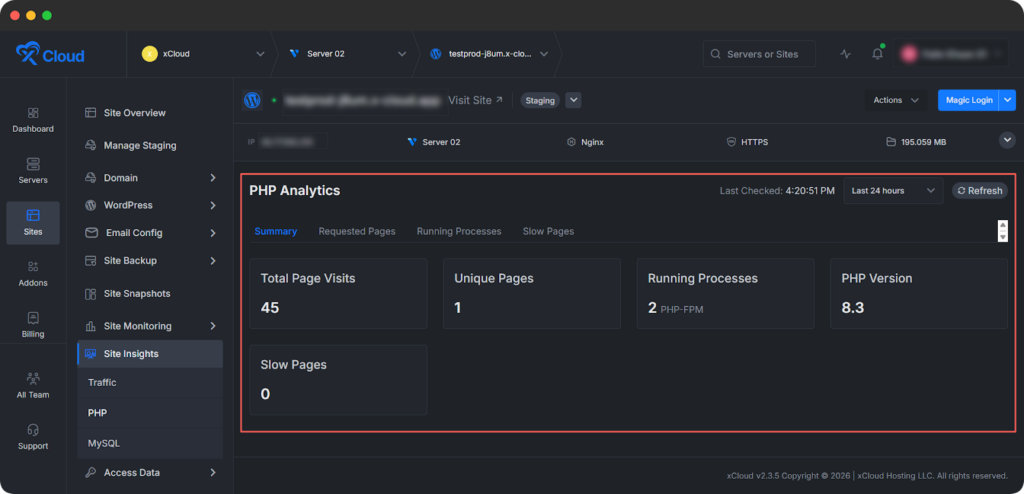
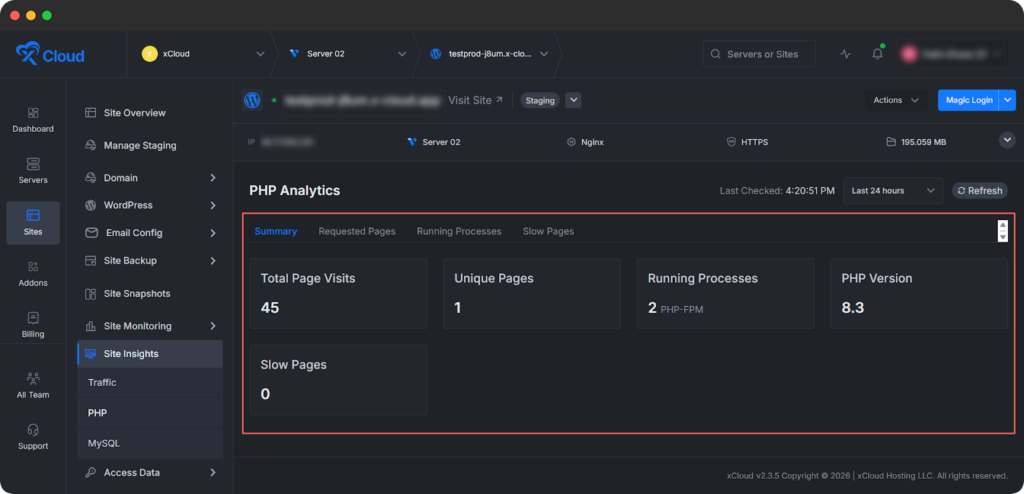
Summary #
This screenshot shows the PHP Analytics → Summary view inside the Site Insights section for a specific site in xCloud.
Four main insights are shown for PHP Summary:
Total Page Visits: Total number of page visits handled by PHP in the selected time range.
Unique Pages: Number of distinct pages requested.
Running Processes: Count of active PHP-FPM processes for this site.
PHP Version: The PHP version currently used by this site.
Slow Pages: Number of pages detected as slow (based on PHP-FPM slow log thresholds) in the selected period.
Overall, this view gives a quick, high-level summary of PHP activity for the site: traffic volume, how many pages are being hit, how many PHP-FPM processes are running, which PHP version is used, and whether any slow pages were detected in the chosen timeframe.
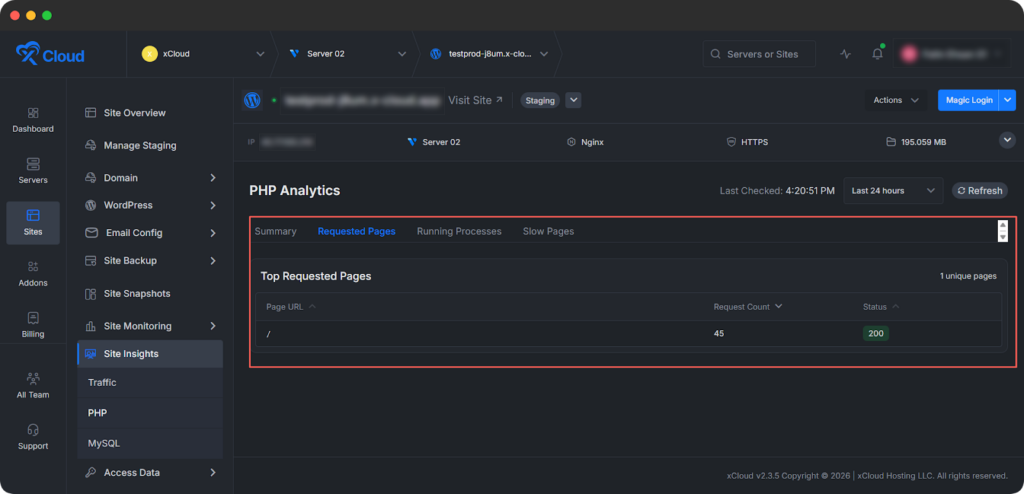
Requested Pages #
This view displays the ‘Top Requested Pages’ on your site along with unique page click counts. It helps you identify the most active pages, spot unusual traffic patterns (for example sudden spikes that might indicate abuse or viral content), and prioritize optimization for high-traffic areas.
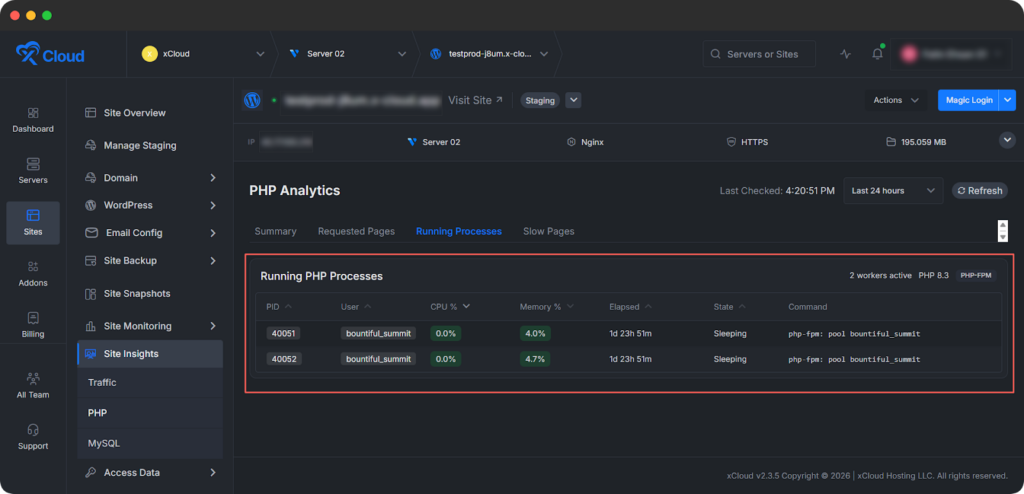
Running Processes #
The ‘Running Processes’ section shows live details for each PHP process, including:
- PID (Process ID)
- User
- CPU% (CPU usage percentage)
- Memory% (Memory usage percentage)
- Elapsed (Time elapsed since process start)
- State (Current process state)
- Command (The specific command or script running)
Go to this tab and detect resource-heavy processes, identify scripts consuming excessive CPU or memory, and stop inefficient processes when necessary.
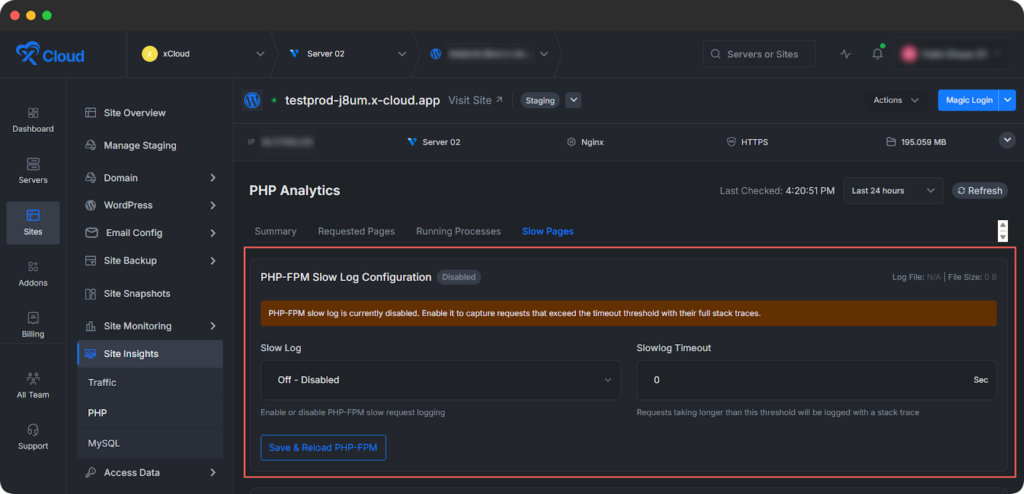
Slow Pages #
Slow Pages section shows detailed PHP-FPM slow log information, including:
- PHP-FPM Slow Log Configuration: Settings like the slow log file and timeout thresholds
- Slow Log Entries: Logs of pages exceeding slow execution thresholds, with timestamps and execution times
Go to this tab to pinpoint specific pages or scripts that regularly exceed your slow thresholds so you can review code, queries or external calls causing delays.
Step 4: Check MySQL Insights #
Use MySQL Insights to see how your database handles live queries and connections. This is where you detect bottlenecks, slow queries, and configuration issues that can slow down your entire application stack.
Click the ‘MySQL’ option to view comprehensive database insights, starting with an overall Summary followed by detailed tabs for deeper analysis.
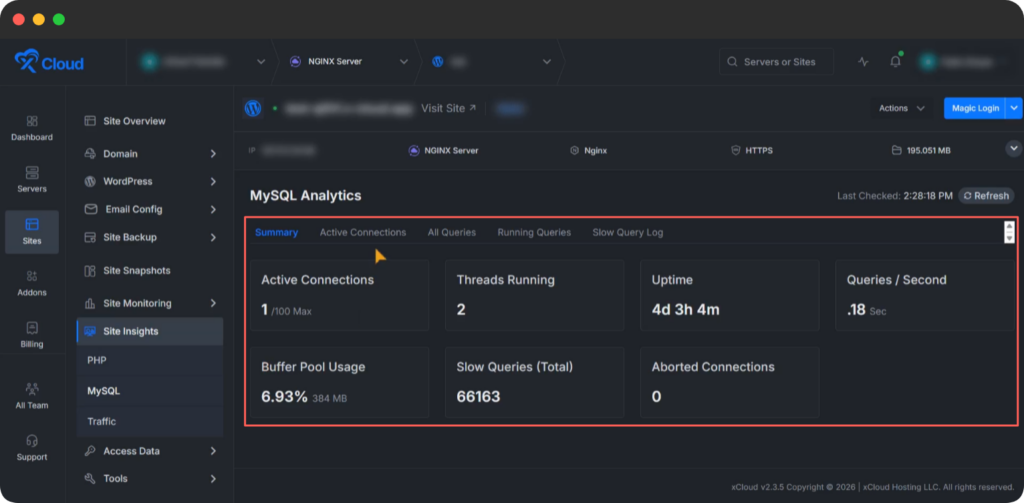
Summary #
The Summary provides key metrics at a glance:
- Active Connections
- Threads Running
- Uptime
- Queries per Second
- Buffer Pool Usage
- Slow Queries (Total)
- Aborted Connections
These metrics help you quickly assess database load, stability, and query behavior so you can decide whether you need to optimize queries, adjust configuration, or scale resources.
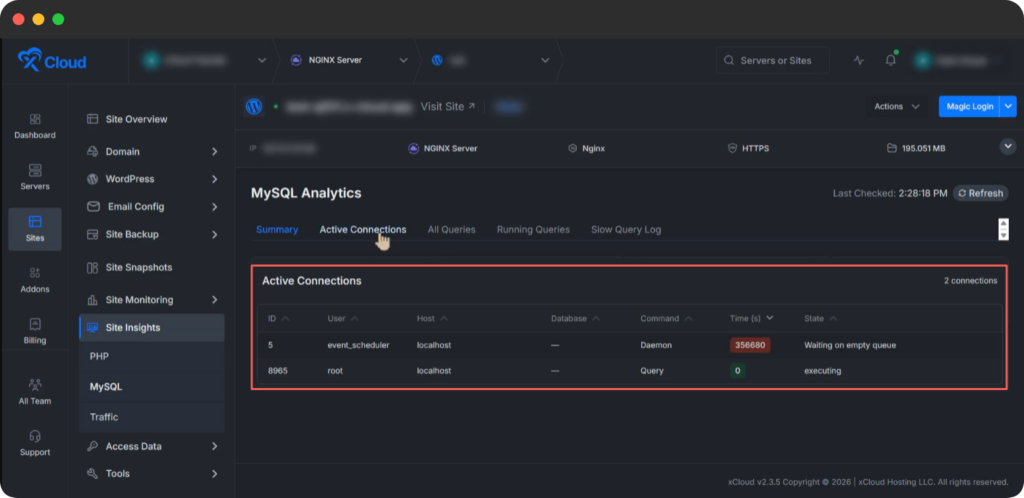
Active Connections #
The Active Connections tab lists live connections with details:
- ID
- User
- Host
- Database
- Command
- Time (s)
- State
Go to this tab to see who is connected, what they are doing, and how long queries have been running. It is especially useful for identifying long-running or stuck sessions that may need investigation.
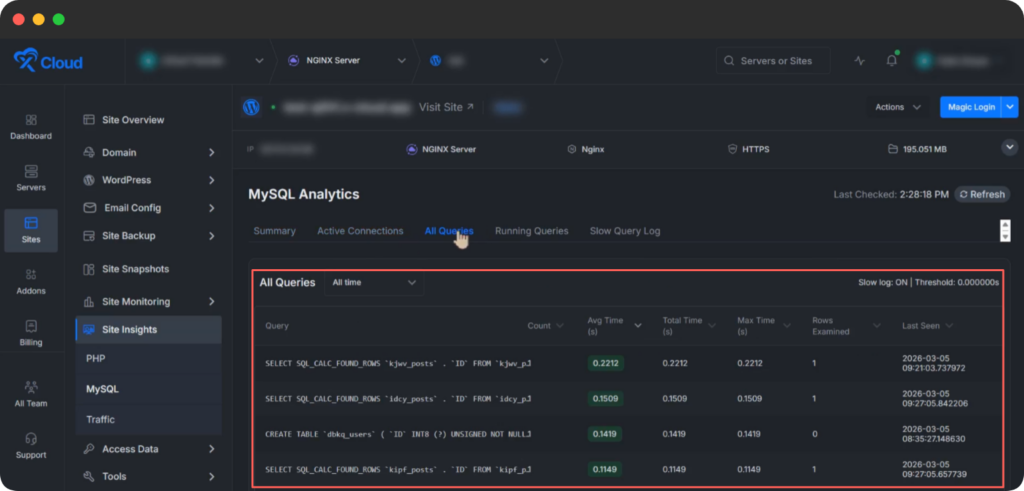
All Queries #
The All Queries tab shows queries from the last 15 minutes up to 24 hours, including slow log status (on or off) and the threshold duration in seconds.
Use this view to review recent query activity over different time ranges, find patterns in heavy queries and correlate slowdowns with specific operations or time windows.
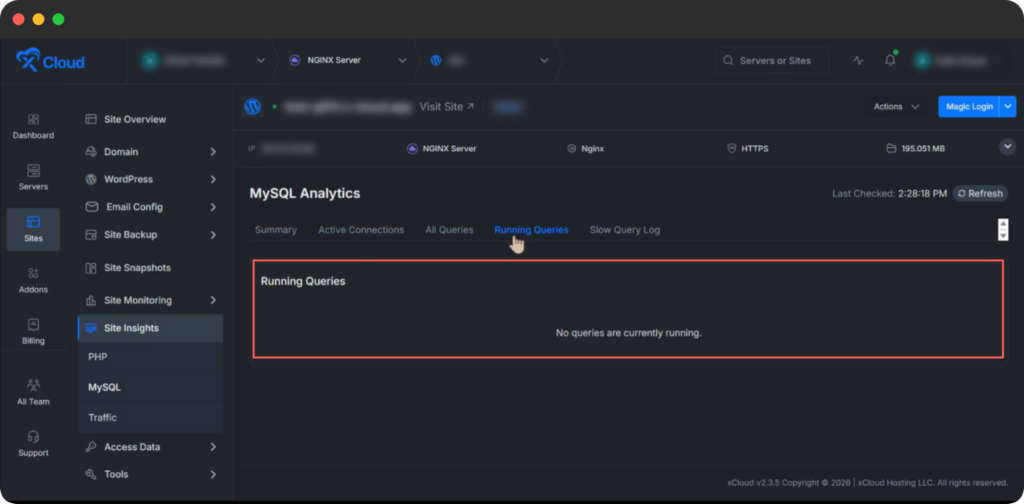
Running Queries #
The Running Queries tab displays queries that are currently executing for real-time monitoring.
Go to this tab to monitor live load, see which queries are currently consuming resources, and react quickly when response times start to increase.
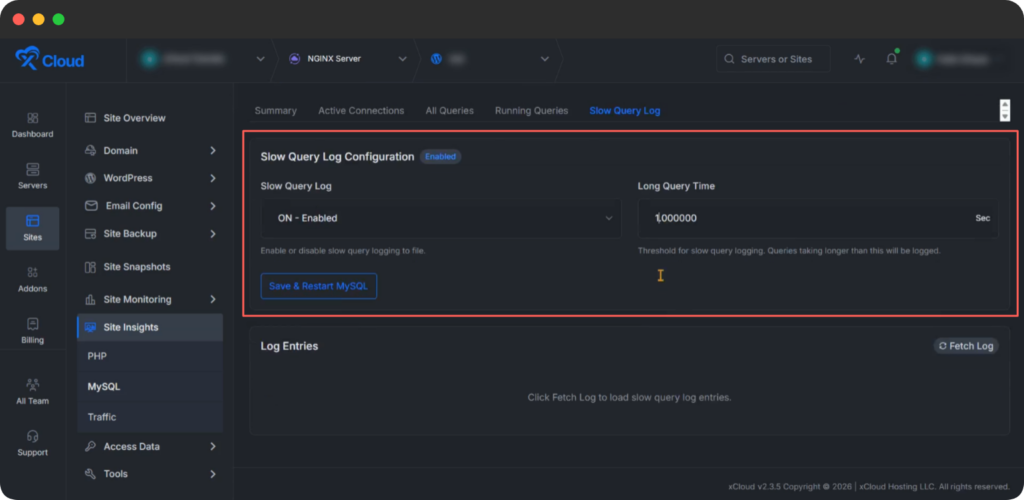
Slow Query Log #
The Slow Query Log section offers configuration and log management options:
- Slow Query Log Configuration
- Enable or Disable Slow Query Log
- Long Query Time (Threshold for logging slow queries)
- Save & Restart MySQL
- Log Entries
Use this area to configure how slow queries are logged, set an appropriate threshold for your workload, and review logged entries to optimize problematic queries.
These sections help you monitor database health, identify bottlenecks and optimize queries effectively.
These detailed views empower you to detect anomalies, refine security and scale traffic handling with confidence.
That’s it. With Site Insights, you can monitor PHP, MySQL and traffic regularly to keep your site fast, stable, and efficient. Use these reports during performance reviews, after deployments, and whenever you notice slow responses or traffic spikes.
Still stuck? Contact our support team for any of your queries.


