


xCloud provides built-in reporting tools for managed WordPress websites, removing the need for manual data collection.
Keeping clients informed about website performance, maintenance activity and security status is a key part of professional WordPress management.
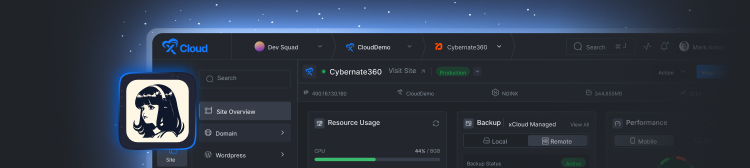
With xCloud, you can generate detailed client reports directly from your dashboard and present all essential WordPress site data in a structured format.
A WordPress website maintenance report helps agencies clearly communicate ongoing site health, updates and security performance to clients.
The reports include uptime monitoring, backup status, plugin updates, security scans and optimization logs, helping you maintain clear and consistent client communication.
This step-by-step guide shows how to generate client reports from your dashboard, including key metrics such as site health, backups, SSL status and more in just a few clicks.
Step-by-Step Guide to Generate WordPress Website Maintenance Reports on xCloud #
This documentation will walk you through the complete process of generating client reports on xCloud, including how to select report data, customize report settings, choose a reporting period and download reports with your clients effortlessly.
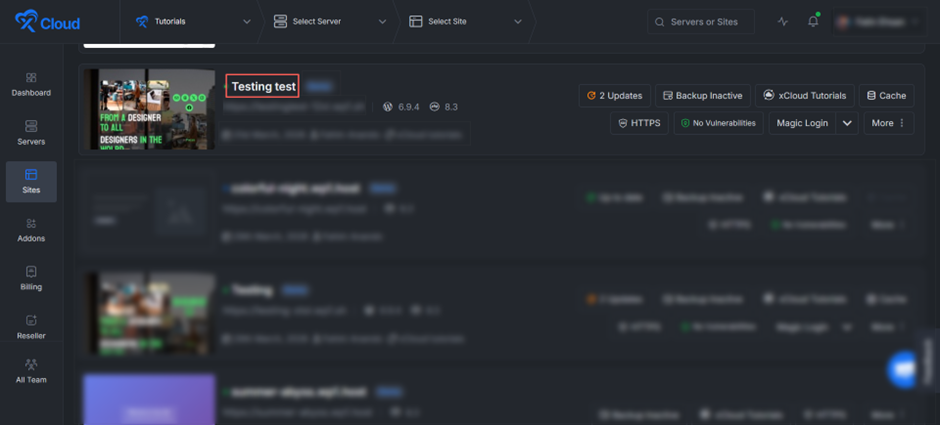
Step 1: Navigate to Your Target Site #
To begin the reporting process, you first need to access the specific website you want to analyze.
Log in to your xCloud dashboard and locate the main navigation menu on the far left side of your screen. Click on ‘Sites’ and then select the specific website you wish to manage from your active list. This will open the dedicated management dashboard for that particular site.
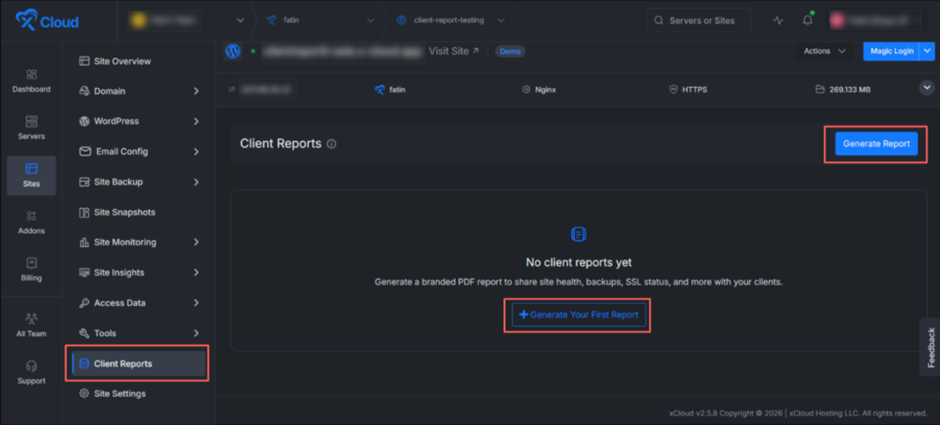
Step 2: Access the Client Reports Menu #
Once you are inside the individual site’s dashboard, look at the inner left-hand sidebar menu. This menu contains all the specific settings and tools for your selected website.
Scroll down near the bottom of this list and click on the ‘Client Reports’ tab. This action will open the main reporting interface in the center of your screen.
If you have not created any reports for this site yet, you will be greeted by a clean, empty-state screen displaying the message: No client reports yet.
To start generating your comprehensive report, you can click on either ‘Generate Your First Report’ or ‘Generate Report’ of the highlighted action buttons on the screen.
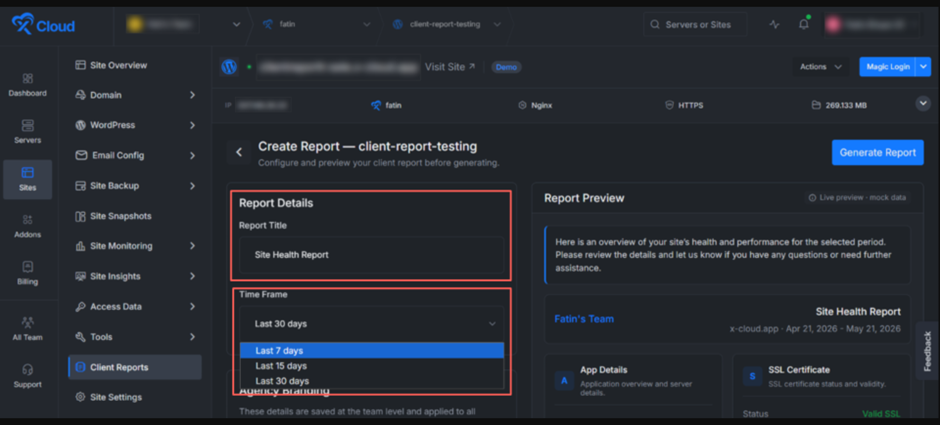
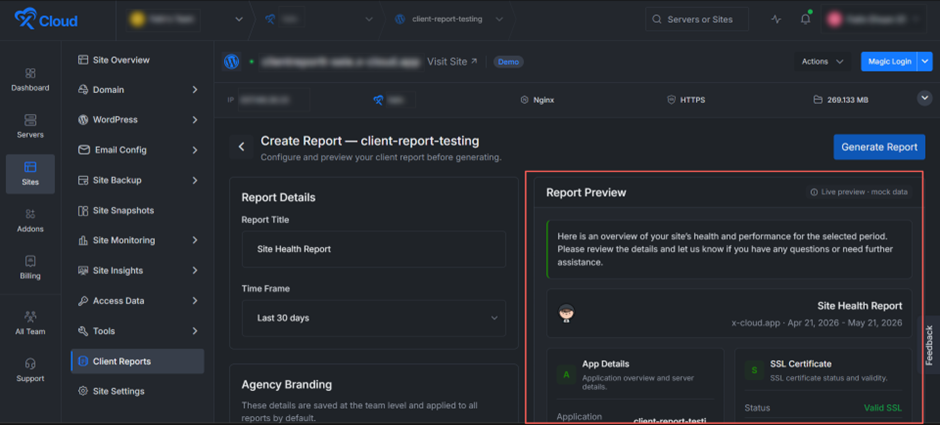
Step 3: Configure Report Details #
After clicking ‘Generate Report’, you will be taken to the ‘Create Report’ screen, where you can customize the data being pulled for your client.
Focus on the Report Details section on the left side of your screen:
- Report Title: Enter a clear, professional name for the document in the text box (e.g., “Site Health Report”). This is the title your client will see.
- Time Frame: Click the dropdown menu to select the date range for the data you want to include. You can choose from standard intervals such as the Last 7 days, Last 15 days or Last 30 days, depending on your reporting schedule.
Step 4: Customize Your Agency Branding #
As you scroll further down the ‘Create Report’ screen, you will find the ‘Agency Branding’ section just below the Time Frame area.
These details are saved at the team level and applied to all reports by default, giving every PDF a consistent and professional look across your entire client base.
- Within this section, fill in the following details:
- Logo: Click the Change button to upload your company logo. Accepted formats are PNG or JPG with a maximum file size of 2MB. This logo will be displayed prominently at the top of every generated report.
- Company Name: Enter your business or agency name. This name will appear as the report sender in the header.
- Website: Add your official website URL so clients can quickly visit your business directly from the report.
- Contact (Email and Phone): Provide your business email and phone number so clients have a direct line of communication after reviewing their report.
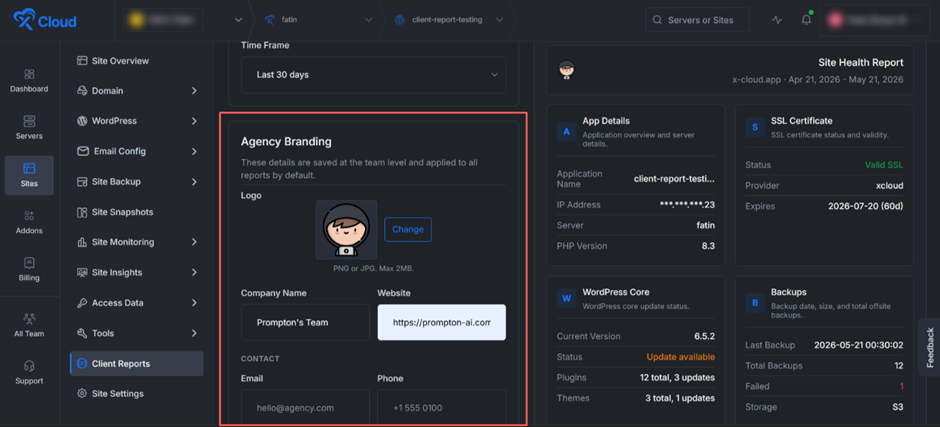
Once everything looks good, click the ‘Save Branding’ button to apply these settings across all your future reports.
Step 5: Add a Personalized Report Message #
Just below the Agency Branding panel, you will find the Report Message section. This area allows you to add optional intro and outro text that will appear only on this specific report, which is a great way to personalize communication with each client.
Intro Text: Write a short greeting or summary that appears at the very top of the report.
Outro Text: Add a closing message at the end of the report.
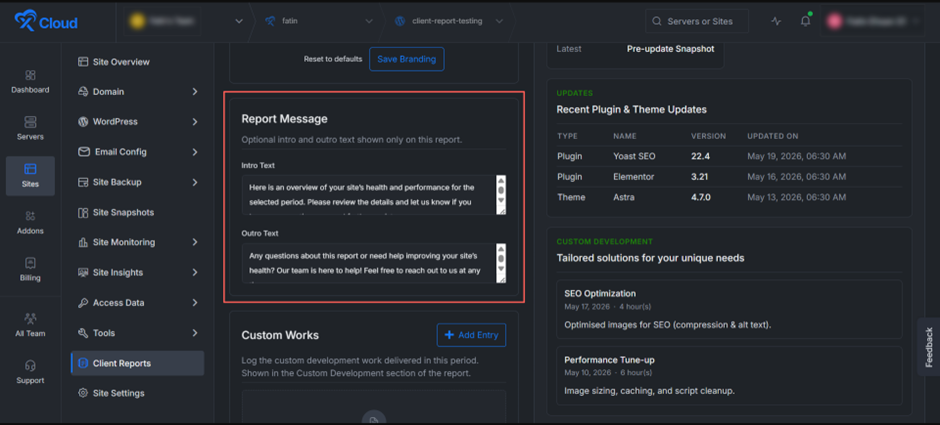
Note: Unlike the Agency Branding details, these messages are tied only to the current report and will not carry over to future ones. You can customize them every time you generate a new report.
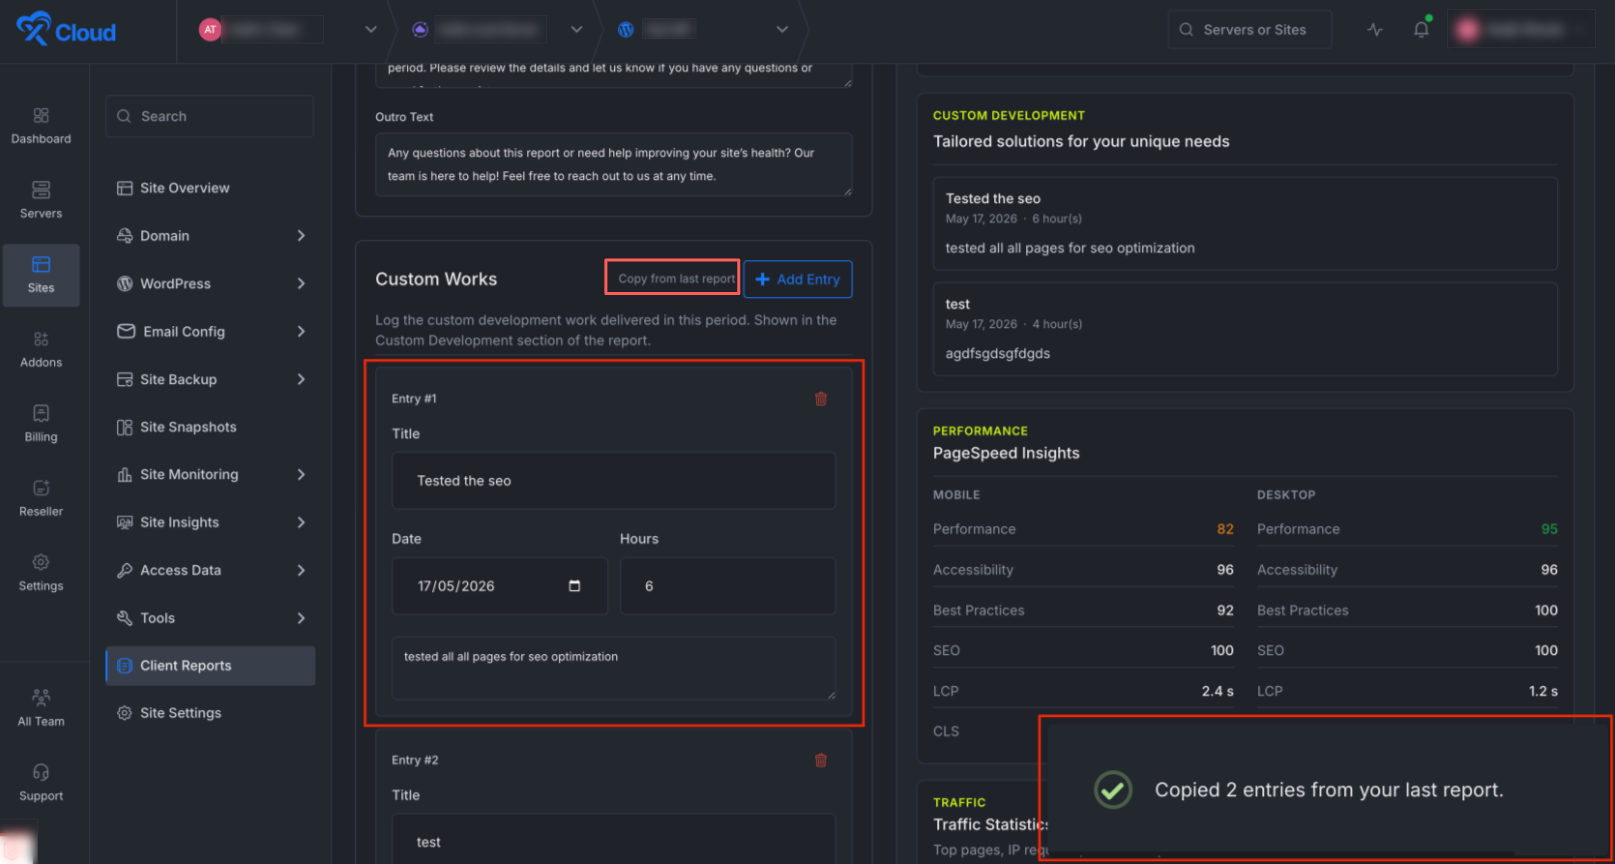
Step 6: Log Your Custom Development Work #
The Custom Works section lets you log specific development tasks or services your team has delivered during the reporting period.
These entries are highlighted under the Custom Development section of the final PDF, which is perfect for showcasing the ongoing value you provide to your client.
To add a new task, click the + Add Entry button on the right side of the section. A new entry block will open up. For each entry, fill in the following details:
- Title: Provide a short, descriptive name for the task.
- Date: Use the date picker to select the day the work was completed.
- Hours: Enter the total number of hours your team spent on the task.
- Description (optional): Add a short explanation of what was done so the client gets clearer context.
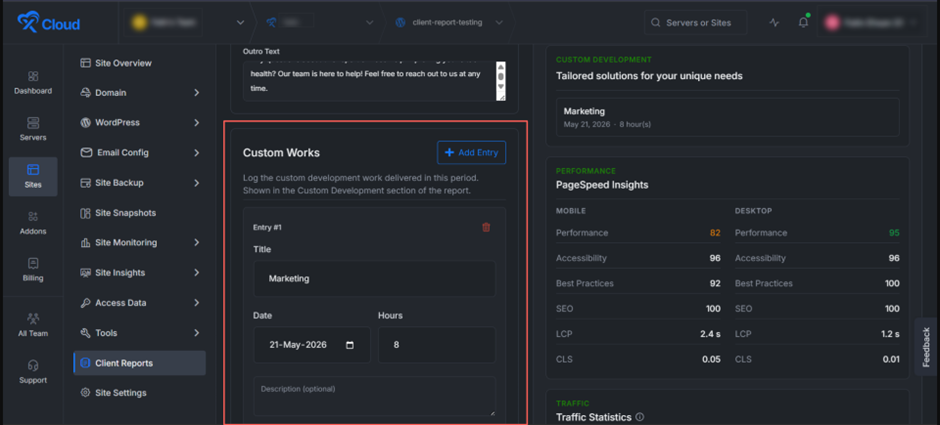
You can add multiple entries to highlight every meaningful task your team handled during the reporting period. To remove an entry, simply click the ‘trash icon’ next to its title.
Step 7: Copy Custom Works from the Previous Report #
When creating a new client report, the Custom Works section includes an option to reuse previously added configurations.
If a report has already been generated for a client, you will see a “Copy from Last Report” option during setup.
Selecting this option automatically imports the custom work settings from the most recent report, allowing you to skip manual configuration.
This is especially useful for agencies that frequently apply similar custom work structures across recurring client reports, helping maintain consistency and saving setup time.
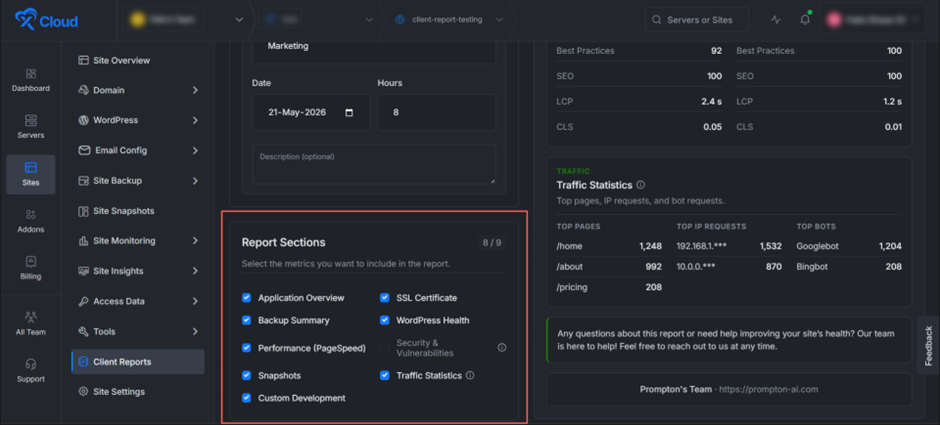
Step 8: Choose Which Sections to Include in the Report #
Next, you will find the Report Sections panel, which is where you decide exactly which metrics appear in the final report. A small counter at the top right (such as 8/9) shows how many sections are currently active out of the total available.
Simply tick or untick the checkboxes next to each section to customize your report’s contents.
The available sections are:
- Application Overview: Displays the application name, server, IP address, and PHP version.
- Backup Summary: Shows the latest backup date, total size, and offsite backup count.
- Performance (PageSpeed): Displays Core Web Vitals and PageSpeed Insights scores for both mobile and desktop.
- Snapshots: Lists pre-update snapshots created for safe rollbacks.
- Custom Development: Pulls in the tasks you added under Custom Works in the previous step.
- SSL Certificate: Shows SSL status, provider, and certificate expiration date.
- WordPress Health: Displays the current WordPress core version along with plugin and theme update status.
- Security & Vulnerabilities: Highlights known security issues and vulnerability scan results.
- Traffic Statistics: Shows top pages, top IP requests, and bot activity for your site.
Note: Traffic statistics are capped at the most recent 7 days, even for 15 or 30-day reports. This ensures that the traffic data remains fresh and accurate without overloading longer reports with outdated visitor information.
Step 9: Review the Live Report Preview #
Before finalizing the document, xCloud provides a handy ‘Report Preview’ section on the right side of the screen.
Take a quick look at the preview to ensure the correct information is populating. You will see a snapshot of vital metrics like App Details and SSL Certificate validity.
The Report Preview updates in real-time as you adjust your branding, message, custom works, and section selections on the left.
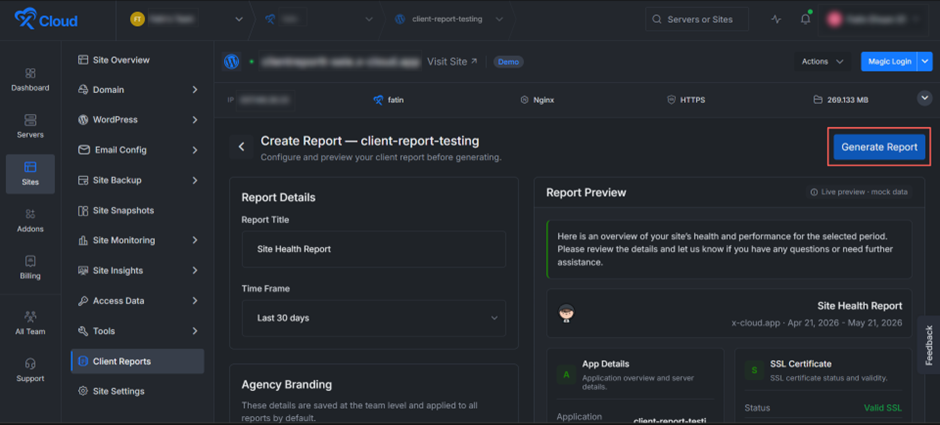
Step 10: Generate the Report #
Once you are happy with your configuration, scroll back to the top of the ‘Create Report’ screen and click the ‘Generate Report’ button on the top right side of the screen.
xCloud will start building your PDF in the background, pulling all the live data from your site, applying your agency branding and assembling the selected sections into a polished, ready-to-send report.
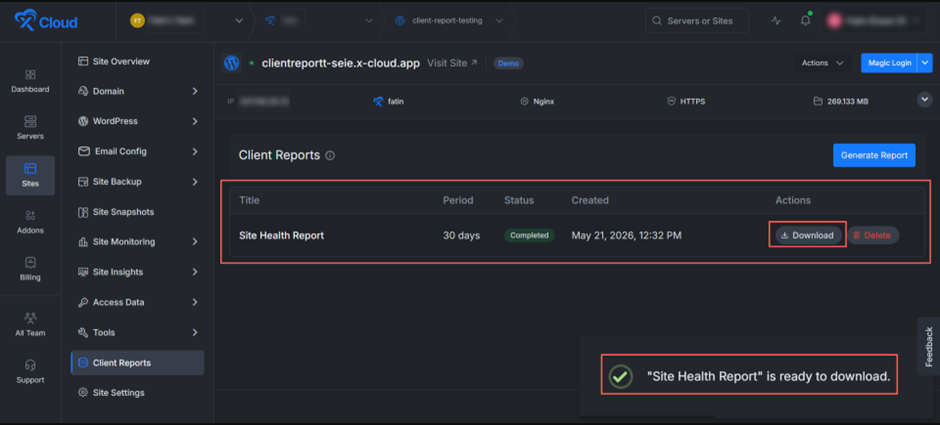
Step 11: Download Your Completed Report #
Once the report is successfully generated, xCloud will redirect you back to the ‘Client Reports’ page. Your newly created report will now appear in the list view, displayed as a clean, tabular row with the following columns:
- Title: The name you assigned to the report (e.g., “Site Health Report”).
- Period: The reporting time frame you selected (e.g., 30 days).
- Status: Indicates whether the report is being processed or is ready. A green “Completed” tag confirms that the PDF is ready for use.
- Created: The exact date and time the report was generated.
- Actions: Two buttons are available for each report. Click ‘Download’ to instantly save the PDF to your device, or click ‘Delete’ to permanently remove the report from your dashboard.
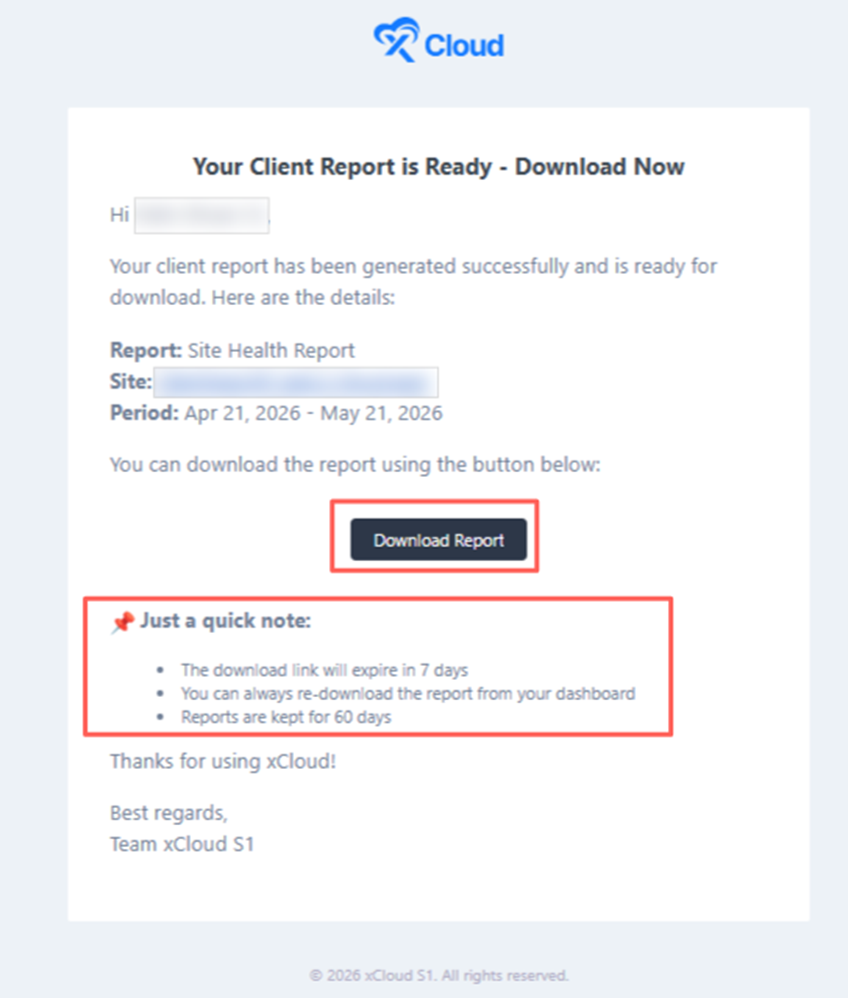
Step 12: Receive the Report via Email Notification #
Alongside the in-dashboard download option, xCloud will also send an automated email notification confirming that your client report is ready.
- Report: The title of the generated report.
- Site: The specific site the report was created for.
- Period: The full date range the report covers.
Below those details, a prominent Download Report button lets you grab the PDF instantly without needing to log back into the dashboard.
‘Just a quick note’ section highlights three important policies:
- The download link will expire in 7 days for security reasons.
- You can always re-download the report from your xCloud dashboard at any time.
- Reports are kept for 60 days before being automatically cleared from your dashboard.
And that’s it! You’ve just walked through the complete process of generating a professional, fully branded client report on xCloud, from selecting your site and configuring report details to customizing branding, logging custom work, choosing your report sections, previewing the output and finally downloading or sharing the PDF.
Frequently Asked Questions (FAQs) #
Is the Client Reports feature available on all xCloud plans? #
Yes! The Client Reports feature is completely free and available on all xCloud plans. You can generate unlimited WordPress website maintenance reports for your clients at no additional cost, regardless of the plan you are subscribed to.
Is Client Reports available for both self-managed and xCloud-managed server sites? #
Yes! The Client Reports feature works seamlessly across both self-managed and xCloud-managed server sites. Whether you are running your own server setup or using xCloud’s fully managed infrastructure, you can generate detailed, professional maintenance reports for any WordPress site connected to your dashboard.
If I generate reports for multiple sites at once, will they be sent in a single email or as separate emails? #
At launch, each site report will be delivered as a separate email notification. So if you generate reports for multiple sites simultaneously, you will receive an individual email for each one. Combining multiple site reports into a single consolidated email isn’t available yet.
Still stuck? Contact our support team for any of your queries.


