

How to Monitor All Your Servers in One Place with xCloud Monitoring
Updated October 17, 2026 · 6 min read
xCloud Monitoring shows the health of every server in your team on one page. Servers that need you come first, each with the reason in plain words, so you can fix a full disk or a stopped service before your clients notice. You can also group your servers by provider, hosting type, region, web server or tag to see where problems cluster.
Monitoring works from the report each server sends every hour. It is a fleet overview. For live readings and process-level detail on one server, use the server’s own Monitoring page, described in How To Monitor Server Resource Usage with xCloud.
Before you start
- Monitoring covers servers on a paid plan. Servers on the free plan are listed as Not monitored.
- A server appears with figures once it has finished setting up and sent its first monitoring report.
- You see the servers your team role gives you access to. See Team Roles & Permissions in xCloud.
Step 1: Open Monitoring
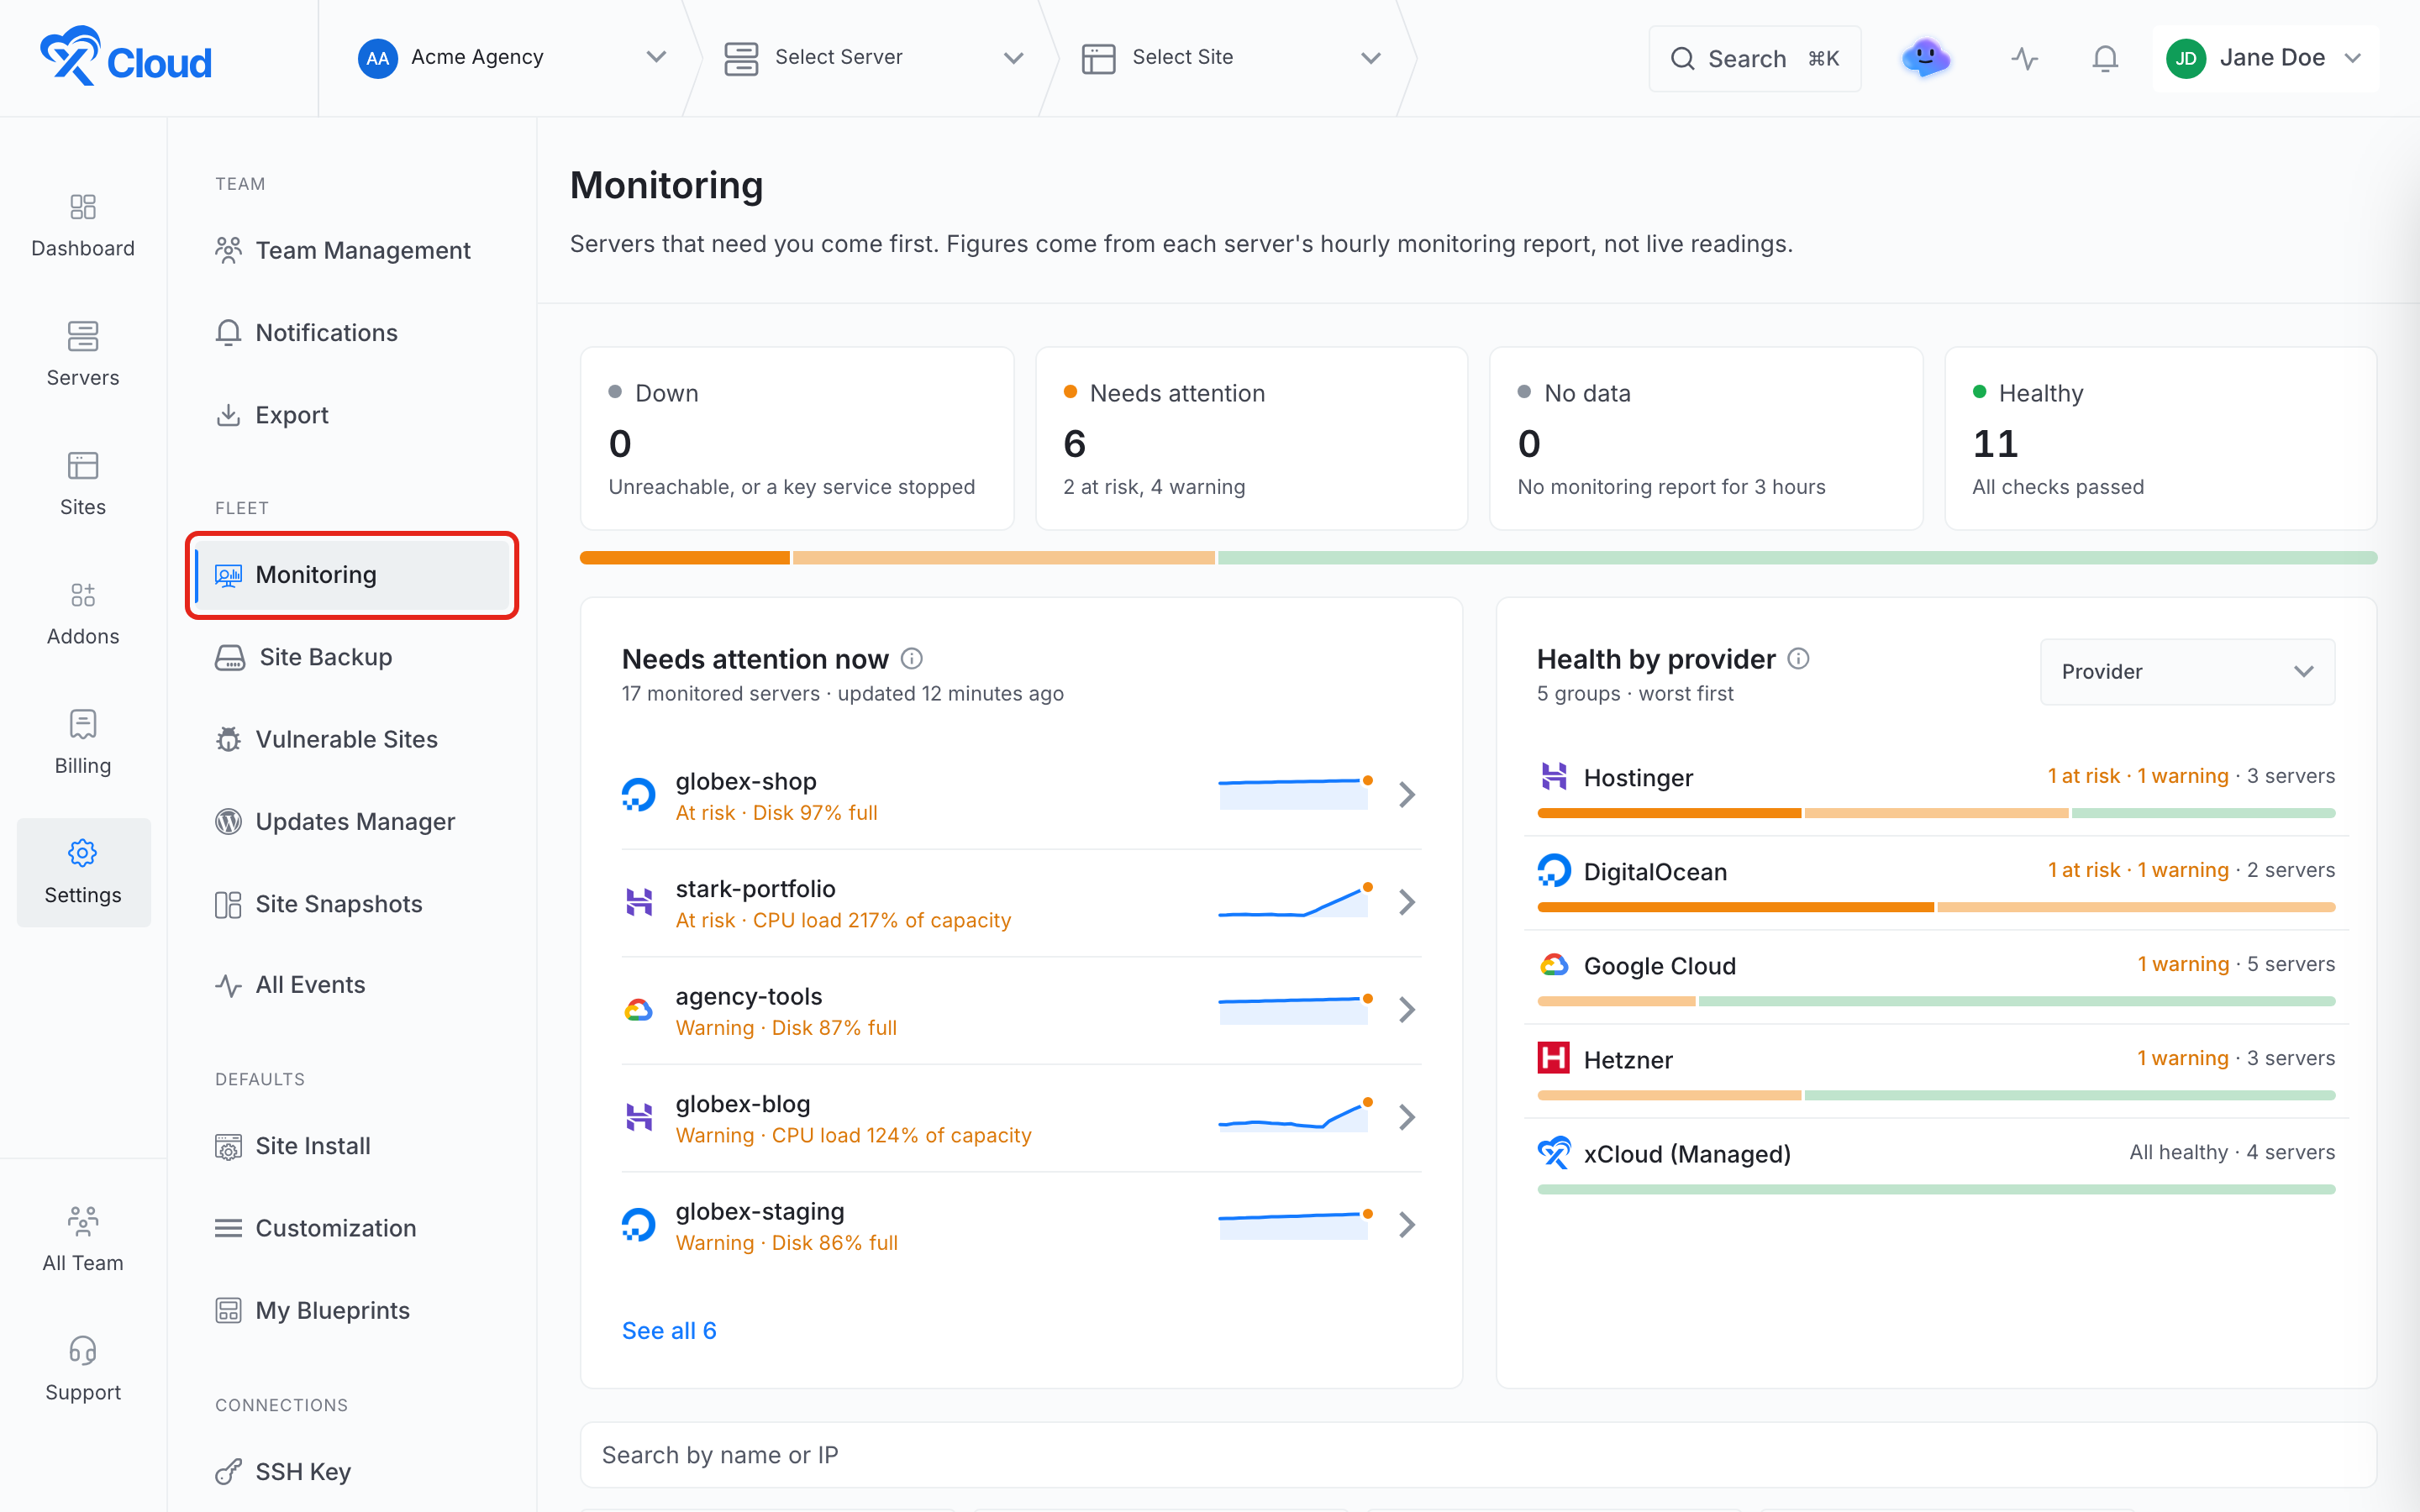
Log in to your xCloud account. Click Settings in the left menu, then click Monitoring under Fleet.
Step 2: Read the fleet summary
The four tiles at the top count your servers by status: Down, Needs attention (at risk plus warning), No data and Healthy. The bar under them shows the same split at a glance.

Click a tile to list only those servers in the table below. Click it again to show every server. Each status is explained in How statuses are decided.
Step 3: Check the servers that need attention
Needs attention now lists up to five servers in order of urgency: down first, then at risk, no data and warning. Each row shows the server’s provider, its status and the reason, such as Disk 97% full or CPU load 217% of capacity.
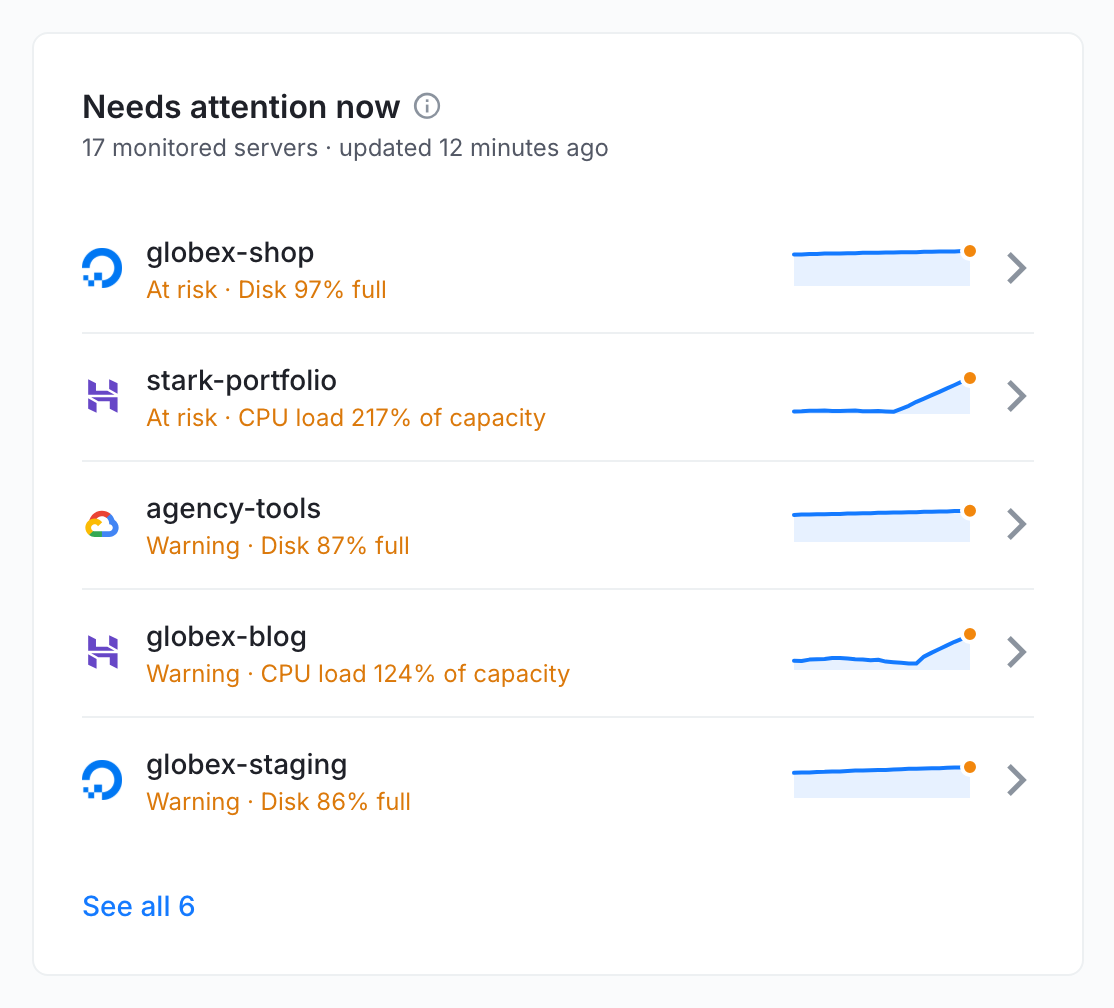
The line on the right is the last 24 hours of the reading behind the reason. Hover over it to see the value and time of any point.
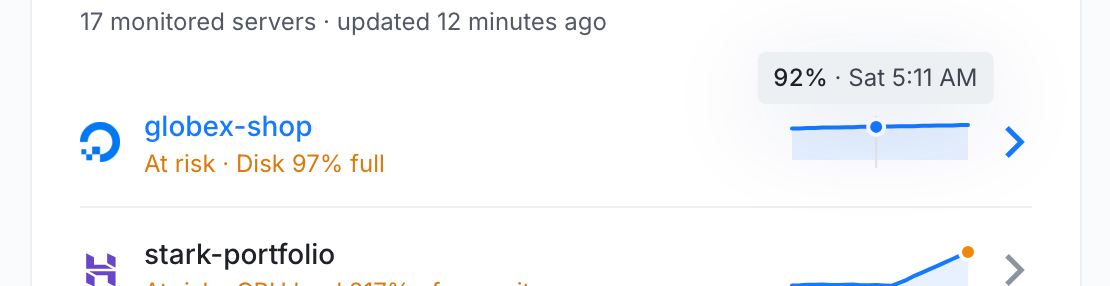
Click a server to open its own Monitoring page. When more than five servers need attention, click See all to jump to the full list below.
Step 4: Find the provider or client in trouble
The Health by card groups your servers and lists the groups worst first. Each bar shows the share of servers in each status. Use the menu on the right to change the grouping: Provider, Hosting type, Region, Web server, Tag, OS version, PHP version, Database or Owner.
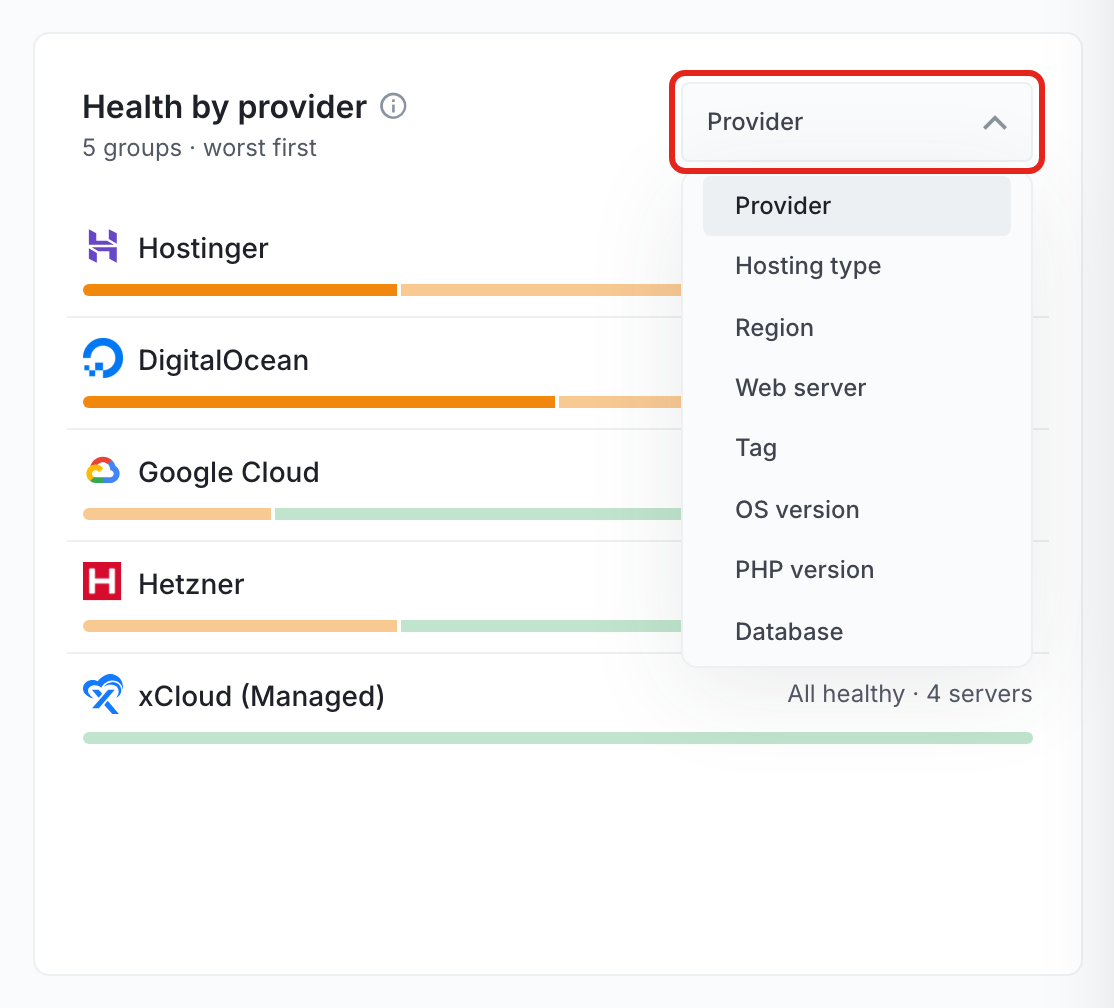
A choice appears only when your servers differ on it. For example, Tag appears once you tag servers, which is a simple way to group them by client. xCloud remembers your choice in this browser.
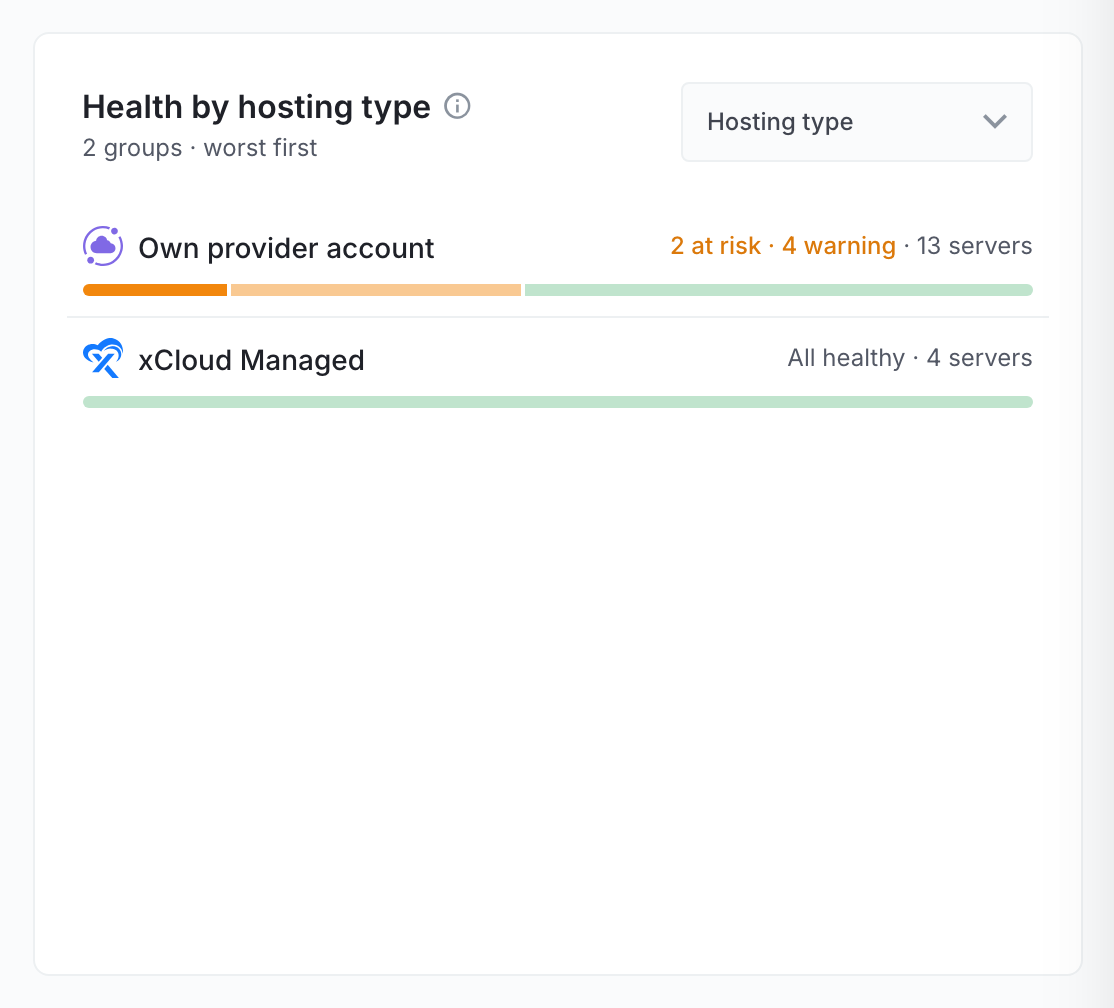
Hover over a group to see its counts, and click it to list its servers in the table.
Step 5: Search, filter and sort the server list
The table lists every server with its status, reason, CPU load, RAM, Disk and Last seen time. Search by server name or IP address, or narrow the list by tag, provider, region or web server. Clear filters and Show all bring every server back.
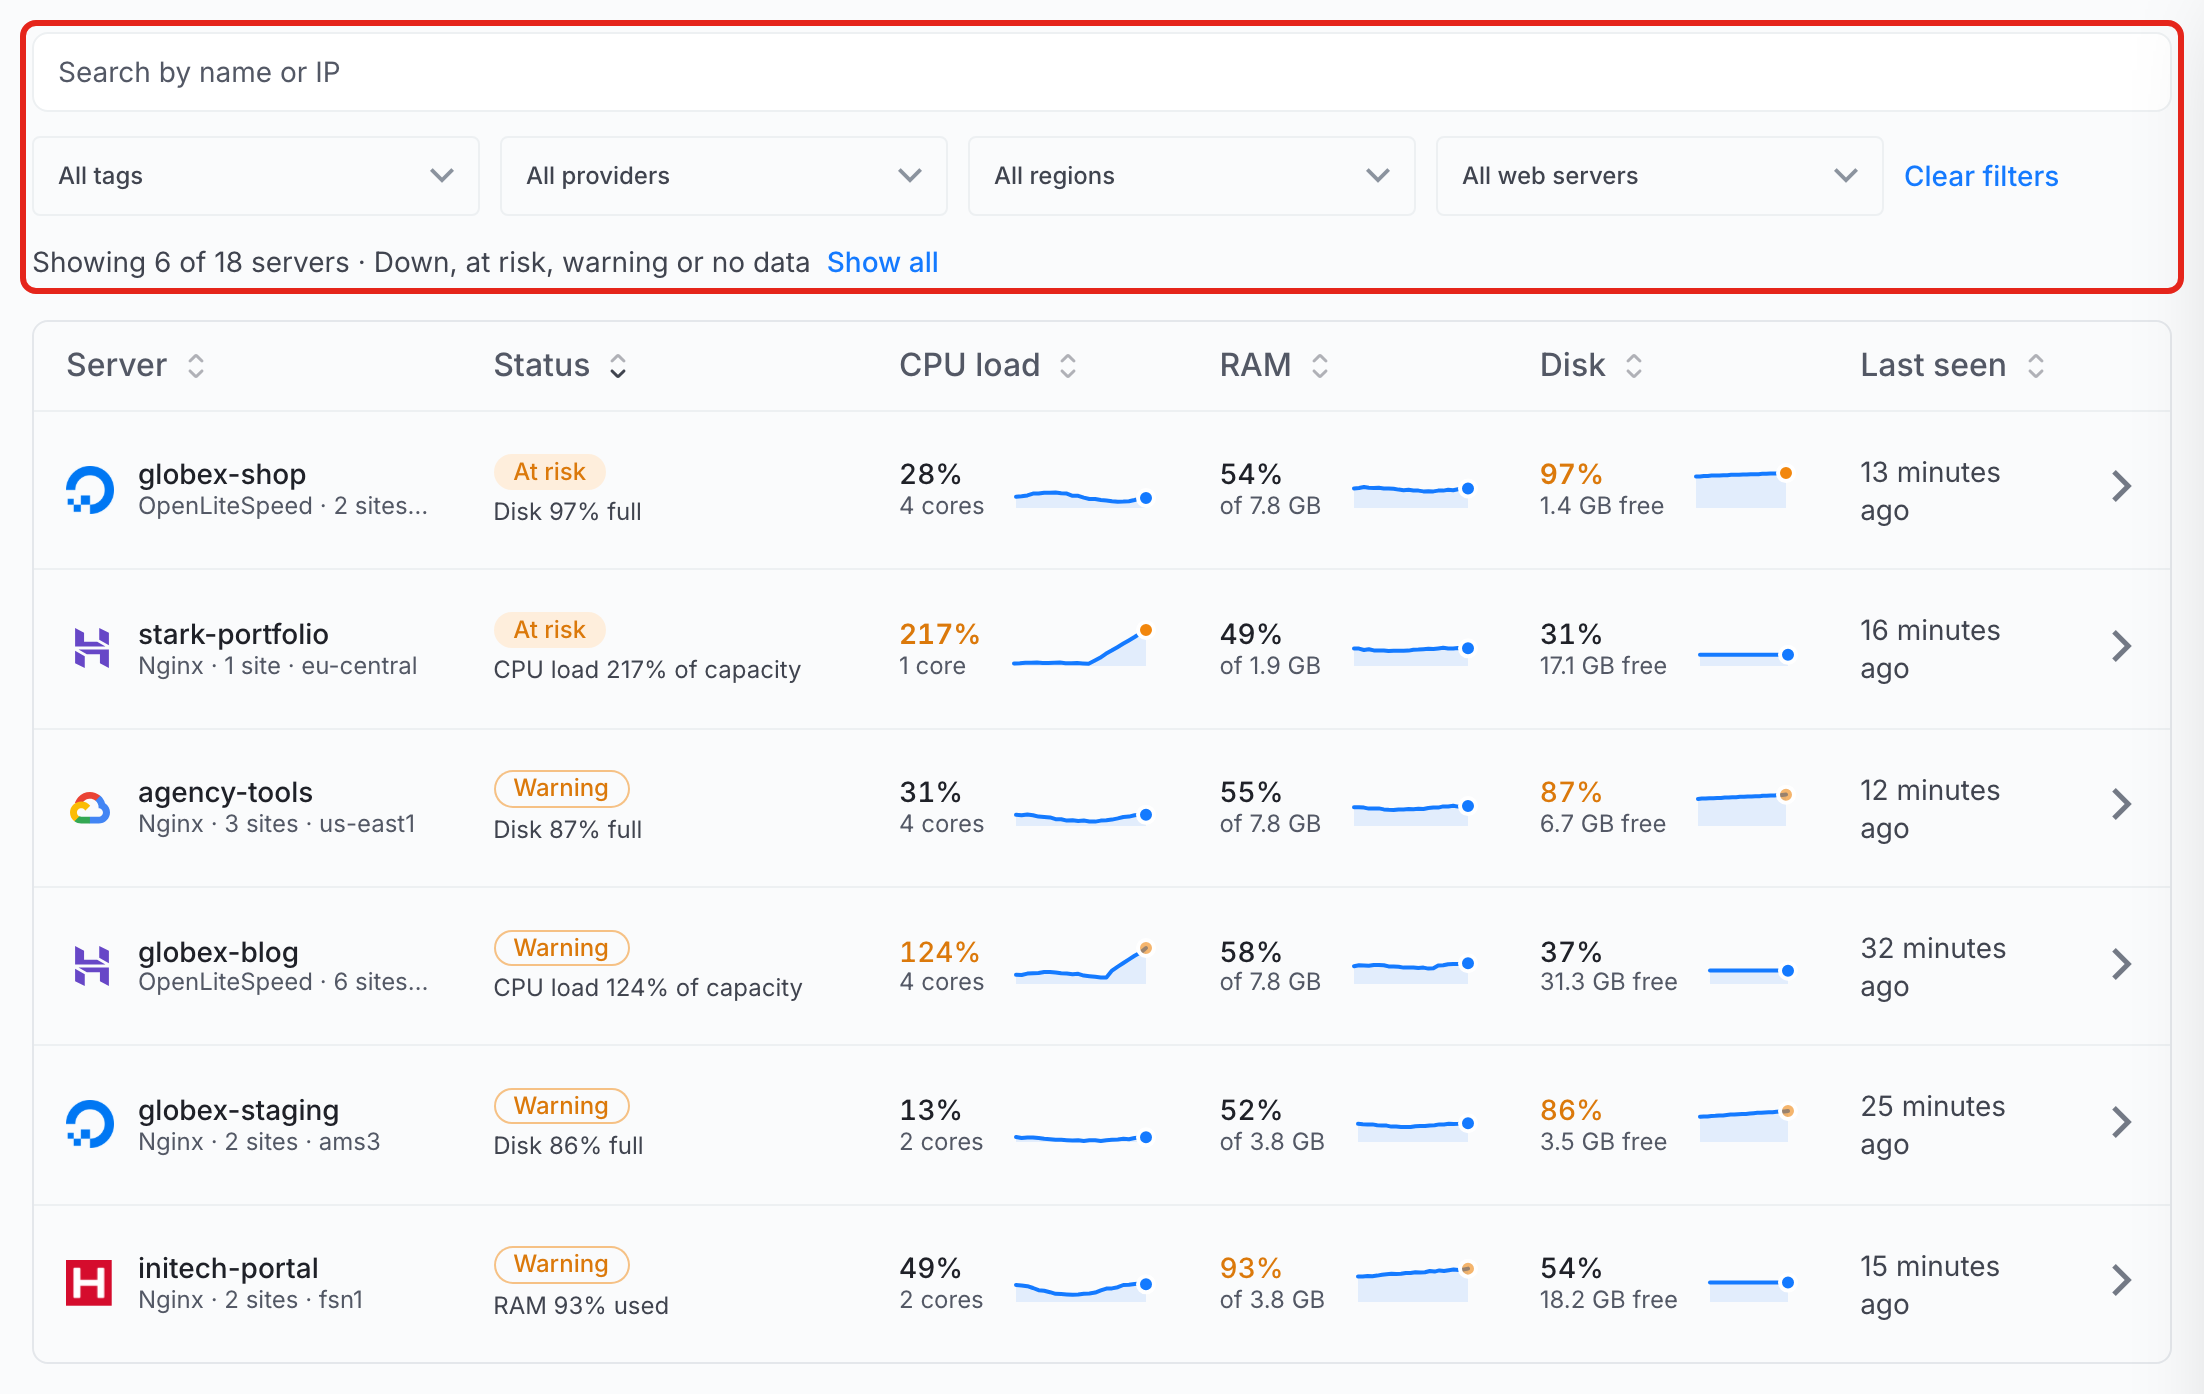
Click a column title to sort by it, and click it again to reverse the order. Each metric has its own 24-hour trend line, so you can tell a disk that filled up overnight from one that has been nearly full for weeks.

Step 6: Open a server for details
Click the arrow at the end of a row to open that server’s Monitoring page. There you can check live RAM, CPU and disk usage, the busiest processes and the largest files and folders. See How To Monitor Server Resource Usage with xCloud.
How statuses are decided
Each server takes the status of its most serious issue. Red is used only for Down.
| Status | When a server gets it |
|---|---|
| Down | xCloud cannot reach the server, or a required service such as MySQL has stopped. Its sites are probably failing. |
| At risk | Disk 95% full or less than 1 GB free, RAM less than 5% available, or CPU load at 200% of capacity or more. |
| No data | The server is online, but no monitoring report has arrived for 3 hours, so its figures are old. |
| Warning | Disk 85% full or less than 5 GB free, RAM less than 10% available, swap 80% used with less than 20% RAM available, or CPU load at 100% of capacity or more. |
| Healthy | All checks passed in the latest monitoring report. |
| Not monitored | Monitoring is off for the server. See below. |
CPU load is the 15-minute load average divided by the server’s CPU cores. 100% means the cores are fully busy, and anything above means work is waiting.
Disk is checked on every disk that holds your sites, databases or system files (/var/www, /var/lib/mysql and /). The reason names the fullest one.
Servers that are not monitored
A server without monitoring is listed at the bottom of the page. Click Show them to list these servers with the reason.

| Reason | What to do |
|---|---|
| Monitoring needs a paid plan | Move the server to a paid plan to turn monitoring on. |
| Server is suspended | Monitoring resumes once the server is active again. |
| Server is still being set up | Wait for provisioning to finish. Figures appear after the first hourly report. |
| Server is being deleted | No action needed. The server leaves the list once it is deleted. |
| Server no longer exists at the provider | The server was removed at the provider, outside xCloud. Remove it from xCloud if you no longer need it. |
Frequently asked questions
How often does Monitoring update?
Each server sends a monitoring report every hour, and the page shows the latest one. The figures are not live readings. When a server sends no report for 3 hours, it shows as No data.
Why is a server marked No data when it is online?
The server is reachable, but xCloud has not received a monitoring report from it for 3 hours, so its figures are out of date. Open the server’s own Monitoring page to check it directly, or contact support if it stays in this state.
Why does a server show a full disk when its root disk has free space?
Monitoring checks every disk that holds your sites, your databases or the system (/var/www, /var/lib/mysql and /). If any of them is running out of space, the server gets a warning, because a full database disk stops MySQL just as a full root disk does.
Who can see the Monitoring page?
Every member of your team can open it. Each person sees only the servers their team role gives them access to.
If you run into any issues while using Monitoring, feel free to reach out to our support team.